Each month, DareBoost relays the figures published by HTTParchive.org and offers you a state of the web. This article deals with the latest data, of August, 1st 2014.
As we are used to doing, we will compare these data, with those of last year (August 2013) and those of last month (read last month’s article), for the top 1 000 most visited websites.
This article is also the opportunity to tell you about Google’s new ranking criterion, related to security.
17% of pages have unreachable resource(s)
Last month, we stated that 4xx and 5xx errors reached a historic peak, with 20% of webpages in this case! Good news in August: this index has lowered back to its value of the last months.
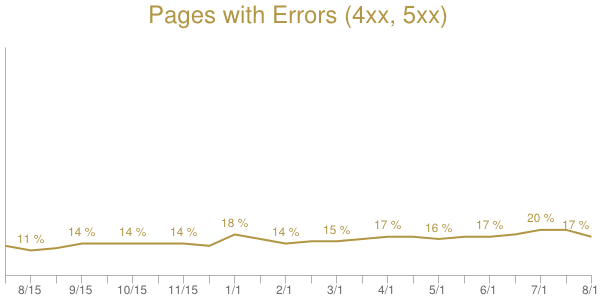
Feel free to check if all your resources are reachable, by analyzing your page with DareBoost.
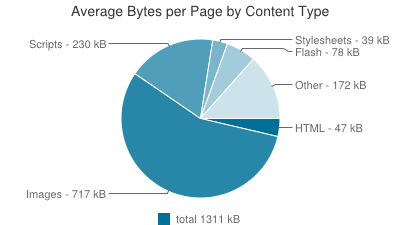
Page weight keeps increasing
The growth is not as significant as it was last month though. With an increase of 1.2% for the first of August, the average weight of the pages in this top 1 000, is now 1 641 kB.
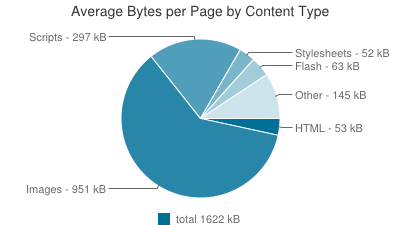
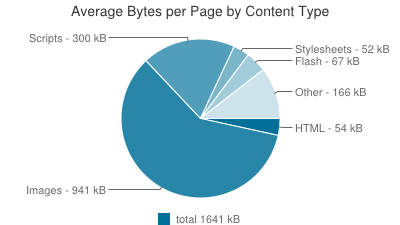
1er Juillet 2014 1er Aout 2014
Strong increase of Custom Fonts use
Between August 2013 and August 2014, the use of custom fonts (Google Font, etc.) has doubled! At the moment, 43% of pages in the top 1 000 use at least one custom font, against only 21% last year.
It is worth recalling that custom fonts do have a real impact on your page load time.
And by the way, we can note that Google Fonts set up an index of the “Impact on page load time”, involved by a font, on their website:
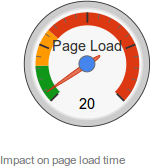
This is a good initiative from Google, to remind their users that the use of custom fonts can impact performance.
30% increase of JavaScript weight
August 2013 August 2014
As you can see in these charts, the total weight of JavaScripts has greatly increased: + 30% in one year.
Regarding the number of requests, we found an average of 18 JavaScripts per page a year ago, against 21 now.
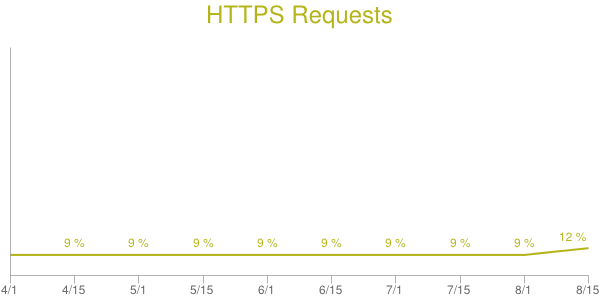
10% of pages use HTTPS, Google makes it a ranking criterion
As we stated in our report of June 2014: The number of secure requests is steadily increasing.
The use of HTTPS has doubled in one year, with now 10% of pages using the secure protocol.
It is the opportunity to tell you that now, Google takes HTTPS into account in its ranking algorithm!
Indeed, Wednesday, August 6, 2014, Google announced:
“…over the past few months we’ve been running tests taking into account whether sites use secure, encrypted connections as a signal in our search ranking algorithms. We’ve seen positive results, so we’re starting to use HTTPS as a ranking signal.”
We can safely assume that this will speed up the use of HTTPs. Be sure to check our next monthly report, we will watch this trend!
By the way, we just published article about the Mixed Content issue, which is related to HTTPs.
Indeed, the fact that 10% of websites in this top 1 000 use the secure protocol does not mean that they do it the right way !
Comparative summary of the figures:
Evolution over 1 year
| August 2013 | August 2014 | Evolution % | |
| Total weight | 1311 kB | 1641 kB | +25,2 % |
| Number of requests | 105 | 112 | +6,7% |
| Images weight | 717 kB | 941 kB | +31,2 % |
| TCP Connections | – | 42 | – |
| Domain number | 21 | 23 | +9,5 % |
| Max requests on 1 domain | 40 | 43 | +7,5 % |
| Cacheable Resources | 60 % | 61 % | +1,7 % |
| Sites with custom fonts | 21 % | 43 % | +104,8 % |
| Sites using flash | 39 % | 34 % | -12,8 % |
| Pages with error | 13 % | 17 % | +30,8 % |
| Compressed responses | 78 % | 85 % | +9 % |
Evolution over 1 month
| July 2014 | August 2014 | Evolution % | |
| Total weight | 1622 kB | 1641 kB | +1.2 % |
| Number of requests | 112 | 112 | +0 % |
| Images weight | 951 kB | 941 kB | -1 % |
| TCP Connections | 42 | 42 | +0 % |
| Domain number | 23 | 23 | +0 % |
| Max requests on 1 domain | 42 | 43 | +2,4 % |
| Cacheable Resources | 61 % | 61 % | +0 % |
| Sites with custom fonts | 42 % | 43 % | +2,4 % |
| Sites using flash | 35 % | 34 % | -2,9 % |
| Pages with error | 20 % | 17 % | -15 % |
| Compressed responses | 85 % | 85 % | +0 % |
To know where your website is situated among all these metrics, you can test our website analysis. You will be given numerous personalized tips for an in-depth optimization of your website!
Moreover, don’t hesitate to follow us on the social networks, Twitter, Facebook and Google+, and be informed of the latest news, regarding web performance.