A few weeks ago, we learned that the support of the Navigation Timing API by Safari was back. This API, available in JavaScript and now on the main web browsers, implements a W3C recommendation. It gives you access to metrics that are essential to understand the many important milestones in your page loading, including performance times.
Performance Timings
Performance timings are part of the Navigation Timings recommendation. Their goal is to detail the main technical steps of a page loading time, from the request handling to the end of the loading of all the resources (except those loaded asynchronously after the onload event).
Here’s an overview of those events in time:
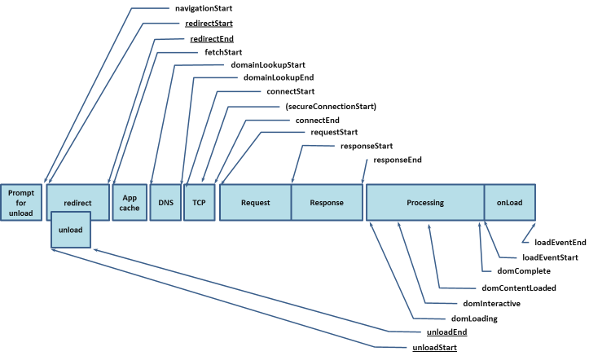
We count not less than 20 events that we can gather in 3 big stages:
- what occurs before the sending of the HTTP request to the server
- the sending of the request/ and the reception of the answer
- the processing of the answer and the building of the web page
For each event, a timestamp is available (number of milliseconds from the 01/01/1970). If you want to obtain the time elapsed between 2 events, all you have to do is calculate the difference between their values. Now, let’s discover these 3 big stages in details.
Preparation of the request
To begin with, the browser handles the user’s request to access a web page (navigationStart). Then, comes the time for the eventual necessary redirection to access the page, provided that these redirections take place on the same domain (redirectStart et redirectEnd).
Then comes the fetchStart event, which means that the browser is about to check if it has the desired resource in its cache.
If there is no redirection on the same domain and if the resource is not found in the cache, you’ll find the DNS lookup time (domainLookupStart and domainLookupEnd), followed by the time necessary to establish the connection to the server (connectStart and connectEnd), potentially including an extra event in the case of a secured connection (secureConnectionStart).
Request execution/Response receipt
The second stage of performance timings is for sure the easiest one to grasp. The connection to the remote server is established, all that remains is to send the HTTP request (requestStart), and receive the corresponding response (between responseStart et responseEnd). The difference between requestStart and responseStart provides the Time To First Byte.
Browser processings
The last step of the loading remains, and is at the time the hardest one and the one gathering 90% of the user’s perceived waiting according to the golden rule given by Steve Souders: the frontend processing. The browser receives a text response, which has yet to be interpreted and completed with new content in order to display the final page.
The first step is to transform the HTML code into a tree structure (DOM) that can be interpreted and manipulated by the browser. We get the duration of this construction by calculating the difference between domLoading et domInteractive.
Then comes the event domContentLoaded, that allows to determine from when the DOM and CSSOM trees are both ready. At this point, the synchronous scripts and those declared in defer have been executed, as well as the stylesheets that were loaded synchronously.
Once all the resources of the page that are defined in the DOM have been loaded and interpreted, including scripts declared as async, the domComplete event is triggered. Then comes the last step: the browser launches its onload event (between loadEventStart and loadEventEnd), which can trigger new asynchronous behaviors. A small time may pass between the domComplete and the onload event, corresponding to the execution of the JavaScript code associated with the onReadyStateChange event.
Note that the user can stop the loading of the page at anytime. You will then get the events unloadEventStart and unloadEventEnd.
Performance Timings provide solid bases to detect the bottlenecks of your page loading. But they are far from allowing you to understand the loading from the user point of view, since it doesn’t give any information about interactivity or page rendering.
The Start Render, the Visually Complete or the Speed Index are also precious metrics that will help you in your optimization procedures. They will be covered in a later article.