What are the most noticeable figures of 1st June 2014? What has changed on the web since 2013? New statistics and presentation of data published by httparchive.org, which compiles statistics on more than 300,000 websites twice a month.
Weight of pages increased by 16%
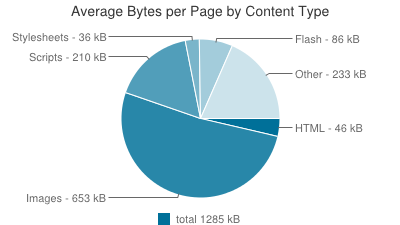
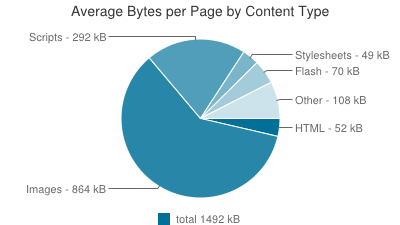
The average weight of the web pages increased by 16% between June 2013 and June 2014, from 1285 kB to 1492 kB (average of the top 1 000 most visited websites).
2013 / 2014
Images constitute by far the largest part of the pages weight (~57.9%), and this weight is still increasing. Indeed, we can note that the weight of iconographic content has increased considerably. The share of Flash content becomes less significant. This can be partially explained by inter-operability problems -including for mobile devices- and by the development of alternative technologies. Without giving more details, one observation must be underscored: for almost all the types of content, websites are getting a lot richer and heavier.
Images: What format is used?
As we just saw it, images have a very prominent place in the pages’ composition, so let’s take a closer look at it. The most used format is JPEG: 48% of images use this format. Then, come PNG and GIF, which both represent 25% of the images. 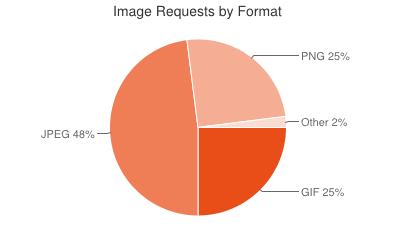 It is good to see that these 3 formats are by far the most used because they are adapted to a web usage. We can note that the use of SVG -whose support by browsers is increasing- remains anecdotal. However, we must remember that 34% of the pages use non-optimized images (source Radware SURS 2014). Indeed, it is very often possible to make an image lighter, without damaging its quality (by limiting the color palette, deleting the meta data…) if we use the adapted tools. Too many websites are still ignoring this easy optimization. Here are two images: one is optimized, (using OptiPNG, which is recommended by Google), the other one isn’t.


Raw image / Optimized image
We observe a 23% of weight decrease. And the quality remains exactly the same, we prevented as well the waste of broadband necessary to load the image from the server. So this optimisation allows you to accelerate the display of the pages which include such images.
DareBoost is a tool able to automatically scan your web pages. Feel free to launch a test to check if your images are optimized, and to see the potential savings.
Average weight of each resource
If we look individually each type of resource and its average weight, we notice that Flash is by far the weightiest element, reaching a peak of 58kB by resource. We can note, however, that it is now present in 36% of the pages against 42% in 2013.
The lightest element is the GIF (4 kB). It is pretty logical since this format is limited to 256 colors, so it is generally used for small images. 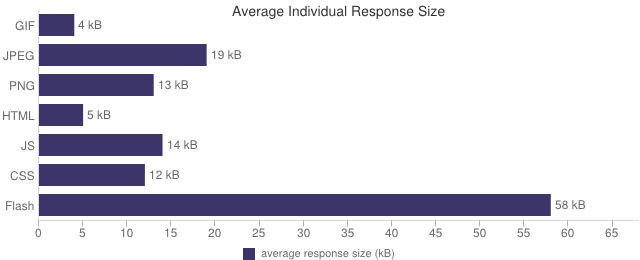 Javascripts have an average weight of 14 kB. For a total of 292 kB, we find then about 20 of these resources by page. It is good to remember that it is possible to gather the scripts into one file. This way, we can limit the number of client-server round trips, which are costly in terms of performance. This also works with CSS files.
The well-known 404 error is often hidden in pages
Almost 1 out of 5 page presents one or several problems of access to some of their resources ! Indeed, we meet 4xx and 5xx errors in 17% of the pages. This figure is unfortunately increasing every year, in these top 1 000 websites. As a reminder, these errors can affect the pages various ways: From an imperceptible impact, to a total impossibility of using the website. The enrichment of web pages would tend to make more difficult the detection/correction of these errors? 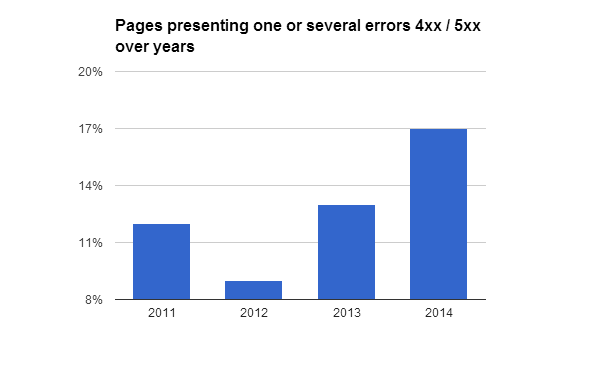
Secured requests
At the moment, 9% of the requests of these top 1 000 websites use the secured version of the HTTP protocol: the HTTPS. We notice that this usage strongly tends to increase. This shows that web players want to make the browsing more secured for their users. 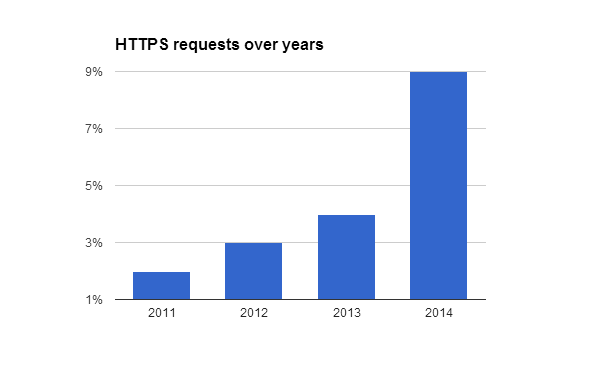 However, this figure has to be put into perspective: if the usage of HTTPS is being generalized, this does not mean that 9% of the pages are secured. This article dedicated to HTTPS (soon available in English) and to a vulnerability related to it, will give you more information.
The HTTParchive tool has been providing exclusive data since June 2014. Let’s have a look at a compilation of it -which is a bit more technical-.
- 56% of the analyzed pages uses more than 20 script tags
- 37% needs the establishment of more than 40 TCP connection (network protocol)
- 34% has a DOM depth higher than 10
- 35% uses localStorage (without any user action)
- The median page height is between 2 000 and 3 000 px
- 71% of the homepages embed one or several Iframe
In the 4th quarter 2013, 45% of the people connected to internet had a broadband lower than 4 Mbps*. We can emphasise a point:very numerous web users have a slow connection, and the enrichment of the websites negatively affects their user experience.
To position your website within all these figures, and to optimize your loading time, you can launch a free audit with DareBoost.com.
*(Akamai report “State of the Internet Q4 2013”)
Hmmm, it looks like that image02.png and image04.png are exactly the same. Indeed they are both weighting 7066 bytes ;)
arg. Totally forgot about this very old post (what are you doing there!?!) when installing our plugin to automatically optimize our images…