When we talk about web performance measurement, what we’re actually trying to determine is the moment when a user can effectively achieve his or her goal. Meaning the users can consult the content they are looking for and/or interact with the page in a satisfactory way. Some metrics endorse rendering actions by the browser, others measure the progress of the display through the recording of a video. However, a great mystery remains: how to properly measure interactivity.
For a few years now, Google has been pushing an ambiguous metric: Time To Interactive. What does it mean? Let’s define it and explain how and when to use it (or not).

TL;DR (Summary)
The measurement of interactiveness is a pregnant challenge for Web Performance experts. Synthetic monitoring solution vendors, especially, find it difficult to provide a computable metric in the absence of user input.
Google’s Time To Interactive is a sophisticated measure designed to determine the ideal conditions for interactivity by monitoring both the JS main thread activity and the network. It’s quite effective at determining a time when you are sure that an interaction will be seamless.
However, TTI is also a complex metric to understand and to exploit that does not measure what most people think it measures, which is the time it takes for a page to become interactive.
Real User Monitoring (RUM) remains the only way to capture user’s actions and even there, we still don’t have a single KPI which simply depicts the relationship between users behavior and the interactivity of the page over time.
The quest for a new metric
What are we trying to measure?
Accessing a web page is an experience that the web performance world generally describes as 4 moments:
- The user has confirmation that loading has started.
- The user has enough information in front of them to think that they can interact with the page.
- The user can interact with the page (this particular moment being dependant of the type of the interaction).
- The user’s interaction with the page is effortless and intuitive, with no delays and jank.
Several signals give the user indications that the loading has started: the url and title change, the browser may animate the tab and / or the favicon, the first non-blank pixels appear, then the rest of the page…
Speed Index and First Contentful Paint give a good idea of the visual perception of visitors. They help to understand the perceived load of the page. They have limitations that can be identified at a glance by a human being through video or filmstrip because their algorithm is directly related to what is displayed.
However, when talking about measuring interactivity – points 3 and 4 – things get harder. Truth is, we don’t actually know how to measure it. The only thing we know how to do well is to collect information that allows us to deduce these particular moments.
For example, Akamai has been looking for new ways to measure user activity for years. They rely on the Boomerang library, created by Philip Tellis. Philip came to We Love Speed 2018 to expose the new user experience metrics that the Boomerang team has been collecting to measure page responsiveness: Rage Clicks, Missed Clicks, Dead Clicks, and Cursor Trashing. By analyzing the distribution of this data qualifying user frustration, we can infer approximately when the user expects the page, or a particular component, to be interactive.
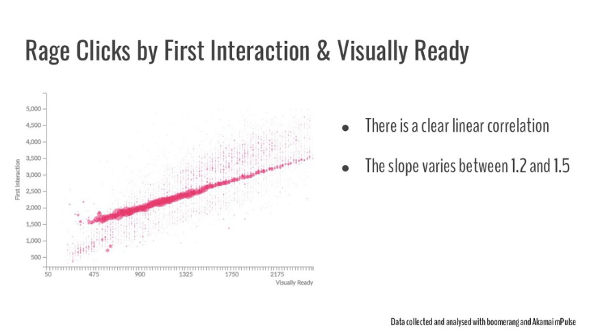
the time to Visually Ready (when the page would look to the user like they could interact with it
– see the full definition on Boomerang documentation).
This type of correlation requires large amounts of data collected from real users, either through JavaScript libraries like Boomerang, or in-browser RUM like the Chrome UX Report. This data can only be collected on production environments with large amounts of visitors.
Testing optimizations in this environment is risky. Without prior testing, deploying in production can introduce regressions/slowdowns and hurt your business. Moreover, you’ll have to wait to collect large enough volume of data, and it will be difficult to evaluate, because RUM data is not so easy to analyze.
Synthetic Monitoring solutions can perform accurate performance measurements on all environments, while controlling test contexts. They would be even more useful if they could provide an interactivity metric.
But since they do not involve real users, they are forced to engage in shenanigans…
Let’s introduce… Time To (Consistently) Interactive
NOTE
Although there are several definitions, we will focus on the definition put forward by Google through their tools and websites.
Interactivity can be considered in two ways: either as a switch between two states (non-interactive and interactive) or as a continuum. Knowing when a page becomes interactive for the first time is interesting but if the interface does not respond quickly, the UX will be very degraded. By “interactivity”, we refer here both to the fact that the page is interactive and to the fact that interactions can take place in a satisfactory way.
Time To Interactive, previously known as “Time To Consistently Interactive”, is an experimental synthetic metric that attempts to measure when your web application is both visually rendered and interactive.

TTI is an interactivity metric that does not rely on real users interactions. Instead, the algorithm makes an approximation by considering that a satisfactory interaction can only happen in specific conditions, and focuses on determining the prevalence of these conditions.
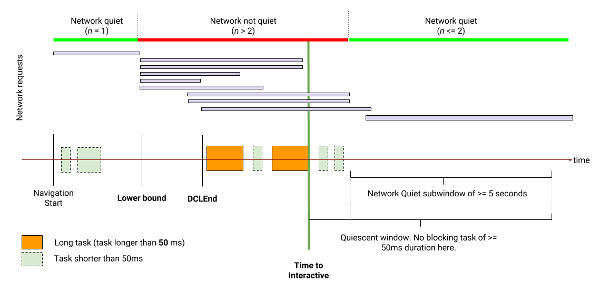
To determine the TTI, the algorithm advances along the timeline, performs checks, and redefines its candidate value for the TTI until it finds a moment where all conditions are met. First, it chooses, as the lower limit, when the user feels that the primary content of the page is visible. Several metrics are available for this: the “Time To Interactive Explainer” uses the First Meaningful Paint, but you can also use the First Contentful Paint, as WebPageTest does.
Then, the TTI’s algorithm verifies that the browser is able to handle the interaction. As many user inputs are handled by client-side JavaScript, working in a single thread environment, the algorithm must then ensure that no long-lasting JavaScript tasks are currently occupying that thread, preventing JS from handling the user inputs right away. For the W3C, a task is “long” if it lasts longer than 50 ms (Long Task). TTI will observe the JS tasks and wait for a 5-second period of time without Long Tasks.
However, all this is useless if the JS code necessary to handle the interaction is not yet downloaded. Rather than finely observing each HTTP response to see if JavaScript resources are downloaded, the Time To Interactive algorithm will use a signal: it will wait until it observes a period of at least 5 seconds during which it never sees more than 2 resources (all types combined) being downloaded in parallel.
If one of the conditions (Long Task and Network) is not met, the algorithm moves its candidate value for the TTI forward and resumes observation to find another Long Task and another 5-second network-quiet window after the last observed Long Task. At that point, the candidate value for the TTI corresponds to the end of the last observed Long Task.
But we’re not finished! At last, the algorithm does not consider a page to be interactive until the browser has finished parsing the document so if the DOMContentLoadedEnd event occurs after our candidate value for TTI, this moment is chosen as the final value for Time To Interactive.
How to use the TTI?
When you start to look at the performance in terms of display, you quickly discover the Visually Complete, i. e. the moment when the entire rendering of the visible area of the page is finished.
Time To Interactive is pretty much like Visually Complete: a time marker for the end of something. The main question is “what?”. Tim Dresser found out the most adequate way to define this: TTI is a “no jank past this point” metric and that’s something you would want to monitor and optimize or, at least, not deteriorate without good reasons.
Indeed, the TTI is computed from the indirect observation of both the CPU – through the JS Long Tasks – and the network activity. If the TTI increases, it definitely means that a JS Long Task happened later than before, during the page load, and it is important to know why. Has a new Long Task been introduced? Is it a previously known tasks pushed back by a new piece of code? Is this a consequence of some newly-implemented third-party dependency?
As we’ll demonstrate later in the article, this Long Task is not necessarily harmful to your UX (for example, if you defer your scripts, then the Long Tasks they produced will occur later) but you can certainly optimize to make sure they don’t happen (for example, you can delegate complex JavaScript algorithms to Web Workers, making them run in background tasks, therefore not occupying the JavaScript main thread).
Common misconception about Time To Interactive
Time to Interactive is not the time until a page is interactive
“Time To Interactive” is a really ambiguous name.
Even in the Lighthouse documentation, you can read short misleading definitions like:
The Time to Interactive (TTI) metric measures how long it takes a page to become interactive.
Fortunately, the sentence is followed by a definition of what “interactive” means here, but for someone who wouldn’t read any further, the damage is done.
As a matter of fact, the Time To Interactive does not measure how long it takes for a page to become interactive, it measures how long it takes to be sure, regarding the conditions, that a interactivity can happen in a satisfactory way, for at least 5 seconds. That’s why the metric was previously known as Time To Consistently Interactive.
We can totally have a very fast and usable page that, however, has a massive TTI. To do this, all you need is for the page to perform Long Tasks of the shortest possible duration, at a rate sufficient to interrupt the TTI observation window. This page, for example, executes a 51ms task every 2 seconds, during a total of 20 seconds and its TTI is over 19 seconds.
Still, the page is perfectly interactive way sooner than the TTI suggests.
In the TTI algorithm, the “network quiet” subwindow is only a signal
TTI is always linked to the last JS long task. The “quiet network” heuristic is just a signal. I’ve seen people asking if they need to improve their waterfall to artificially create cascades containing less than two simultaneous requests. If none of these requests involve a Long Task, you can relax, your TTI will not suffer.
However, as this is a signal only, it does not guarantee that the JS code required to handle the interaction is available at all. You can have pretty good Time To Interactive and a page that is not interactive – as expected by user – at all.
Google’s TTI is not everyone’s
Every time Google introduces a new concept, there is a strong market demand. But be careful, Time To Interactive is not a standard!
Akamai’s Boomerang, one of the most famous Real User Monitoring solution, has its own definition of Time To Interactive, that differs a lot from Google’s. They use different signals like Frame Rate, Long Tasks, Page Busyness (via `setInterval`) and delayed user interactions. Even if they keep the W3C 50ms Long Tasks definition, their window of quiescence is only 500ms long (instead of 5 seconds), which mitigates TTIs from being extended due to isolated tasks.
During my research, I’ve also found that some Synthetic Monitoring solutions claim to support the Time To Interactive metric but, as with load time, you should always verify their definition, because some solutions do not hesitate to brand a “TTI” label on other metrics (such as the domInteractive event) that have nothing to do with Google’s TTI.
Time to Interactive is not easy to stabilize
A metric that is not predictable is difficult to understand. In researching this article, we have gathered this evidence that suggests that the TTI is one of those complex metrics, hard to stabilize.
I tried it out and it was a too unstable metric to measure Wikipedia. Here’s an example: https://phabricator.wikimedia.org/T176369
– Peter Hedenskog, Software Engineer (Contractor), for the Wikimedia Foundation
There are few feedbacks on the TTI
There is little data on the correlation of TTI in the wild and none of them allow us to say that it’s more interesting than the existing metrics.
Based on a first study by Deepanjan Roy (a 28-website scoresheet), Time To Interactive has later been qualified by Tim Dresser, without much success. To be honest, these correlations are very difficult to obtain: as we can see from Tim’s analysis, the correlation of more stable metrics like FCP in the wild vs. in the lab is not good either.
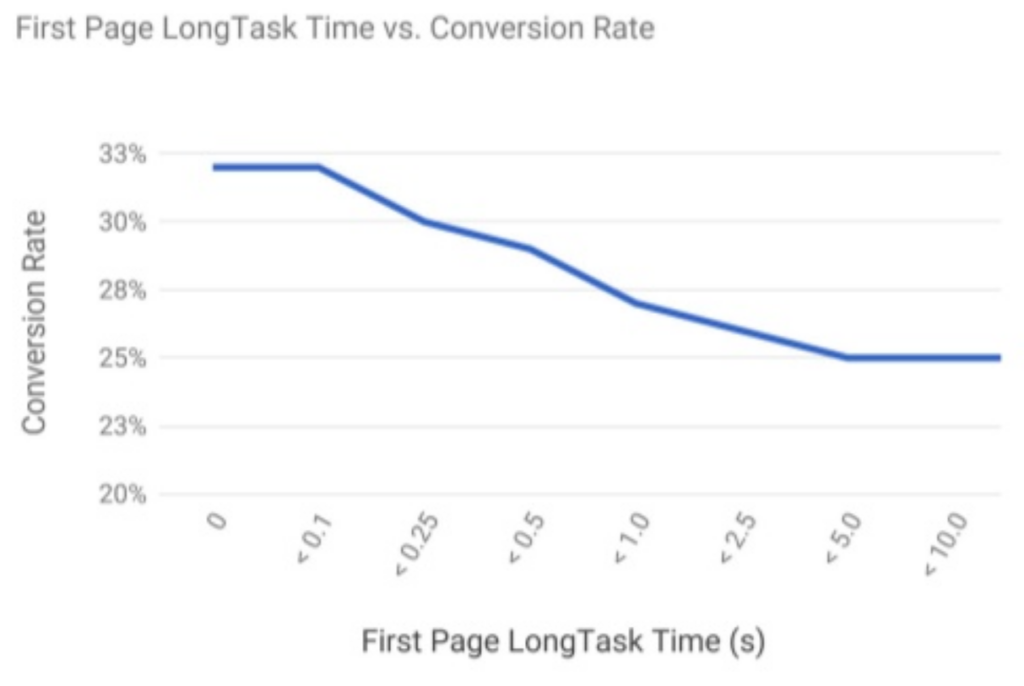
I found one study from 2017, by Nic Jansma, quoted by Addy Osmani, where he explains that improving the TTI has a real impact on conversion rate in a real Use Case but the slides don’t give access to the data nor the experimental conditions.
Other Use Cases available online often consist in removing all JavaScript from the Landing Pages which is a pretty partial move, where other solutions (like downloading and byte-caching the JS in a Service Worker for future use) could have been chosen. Don’t get me wrong, I’m all for reducing the JavaScript to its smallest share, but never at the expense of the user journey.
Time To Interactive is entering a Web Performance landscape that already offers multiple metrics, some of which are easier to understand and comment. Most of the Use Cases I read about Time To Interactive do not clarify whether the existing metrics were sufficient to qualify the situation. Most site owners only monitor and report on 3 or 4 web performance metrics. Before we ask them to drop one of them for this one, I think it’s important that they can get an extensive idea of their respective relevance.
The Long Task “50ms” definition creates a threshold effect
The TTI thresholds have the merit of raising awareness of the importance of performance budgets. TTI is kind of a performance budget: “the main thread activity must stay under the 50ms budget”.
However, the definition of any threshold has impact.
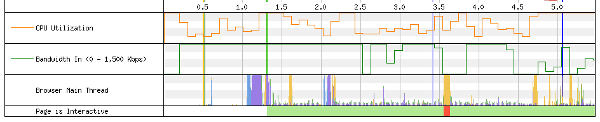
Let’s take a really simple blog post page, and test it on Desktop with WebPageTest. The page is visually ready and completely interactive as soon as 1.2s. At that moment and during several seconds, a visitor can read and scroll freely. Around 3.5 seconds, a reCaptcha script execution creates a 150ms Long Task (in red, on the bottom bar) that push the Time To Interactive forward. Will this delay be perceived by the visitor? By the way, how long would a delay take to be felt by a visitor?
According to the RAIL performance model (Response, Animation, Idle, Load), the user perception of performance delays depends on the nature of the delay. Interaction delays are perceived after ~100ms. A value consistent with Nielsen’s 1993 post, based on Miller & Card et al. studies.
If the perceived delay is 100ms, why consider a JS task as long from 50ms? The explanation lies in the Long Task API specification:
The RAIL performance model suggests that applications should respond in under 100ms to user input (for touch move and scrolling, in under 16ms). Our goal with this API is to surface notifications about tasks that may prevent the application from hitting these targets. We surface tasks that take 50ms or more. A website without these tasks should respond to user input in under 100ms: it will take less than 50ms to finish the task that is being executed when the user input is received and less than 50ms to execute the task to react to such user input.
– Long Task API 1
In other words: handling an interaction requires both that the browser is able to handle the user input by not being already busy (interactivity) and that is can handle fast enough the potential JS code execution triggered by the user action (responsiveness). As we don’t know the actual response time of the browser to handle the triggered processing, we consider this time should be less than 50ms. That leaves 50ms for the browser to be free enough to react to the input.
But in practice, all browsers and browsing contexts are different and there are many factors that can influence the time taken by the browser to process a task.
Interactivity measurement: is TTI enough?
TTI as a new reference metric?
Creating and promoting a metric is a performative act especially when the metric is defined as THE reference metric for interactivity: when pushed by Google, the metric not only evaluates the Web, it shapes it. SEO/SEM experts highly value it to their customers, companies use it in rankings. Quickly, everyone considers the metric as a reference, without questioning its rationale.
However, its many limitations, consistent with its definition based on many approximations, make the TTI a rather binary metric. Either the TTI is very low and you can be happy because you are absolutely certain that the web page offers the best conditions for quality interactions ; or it’s not, and you need to investigate further to know what is happening. Some tasks can be delaying the TTI without bothering end-users but the page may also be unusable. You just don’t have any way to distinguish the two possibilities without further investigation.

A milestone more than an evaluation of a continuum
Time To Interactive is to interactivity what the Visually Complete is to display: a final milestone. What we’re missing is “a Speed Index of interactions” where each Long Task would be weighted by its duration and the time at which it occurs, in relation to other metrics (e. g. rendering metrics) to infer the user’s frustration.
In the previously mentioned study, Nic Jansma observed the distribution of Long Task durations and found a correlation with conversion. I hope that we will make progress on this subject in the coming years.
In the meantime, a lot of other metrics exist regarding interactivity, mainly in RUM, where real user activity can be monitored. For example, I think the distribution of First Input Delays is an extremely relevant self-explanatory information but this would be a story for another blog post.
Remember: if you need to understand what’s happening with your JavaScript code in Synthetic Monitoring, you can still use Custom Timings to deploy a full instrumentation. It’s the best way to grasp what matters to your business.
More about interactivity and the Time To Interactive:
A touch of archaeology
- [1993] “Response Times: The 3 Important Limits“, Jakob Nielsen
- [2015] “Measure Performance with the RAIL model“, Meggin Kearney, Addy Osmani, Kayce Basques, Jason Miller
- [July 2016] “Time To Interactive“, Tim Dresser, Paul Irish, Brendan Kenny
- [December 2016] “Update on defining firstInteractive“, Deepanjan Roy
- [January 2017] “Evaluating definitions of firstInteractive“, Deepanjan Roy
- [August 2017] “First Interactive and Consistently Interactive“, Deepanjan Roy (anchor to the definition of the TTI)
- [February 2018] “Time To Interactive Explainer“, Tim Dresser, Deepanjan Roy
- [May 2018] “First Input Delay: Correlation with TTI“, Tim Dresser
- [January 2019] “Web Page Usability Matters“, Addy Osmani
- [February 2019] “User-centric Performance Metrics“, Philip Walton
Some presentations to discover interactivity indicators
- [Video] “The Latest in Metrics & Measurement“, Paul Irish
- [Video] “UX and performance metrics that matter“, Philip Tellis (slides)
- [Video] “First Input Delay – State Of The Web“, Rick Viscomi
Thanks to Henri, Phillip, Peter, and Tim for having helped me to shape my ideas, and Damien for his multiple proofreading and advice.
Great read. Thanks
Thanks Paul, I’m glad you like it.
Great article Boris, I really feel like this is the best explanation I’ve seen on TTI and how to identify/improve the performance. Thanks for putting it together and explaining it so clearly.
Thank you for this feedback, I am doing my best but it is really a team effort, as other Dareboost colleagues are involved.