We have completed a major update on dareboost.com, that greatly expands the capabilities of our monitoring features.
We are proud to take the next step and offer a more comprehensive tool, always with the same goal in mind: an easy and new way to manage web performance and quality.
After a brief reminder of the absolute need to monitor your website speed, I’ll detail you the changes coming along with this update.
Why should you monitor the speed and quality of your websites with Dareboost?
You have launched an analysis of your website on dareboost.com, and all metrics look good? That is a good news. However, will it still the case ?
Unfortunately, the answer is almost certainly “no”. A too heavy picture added on the home page, a widget that causes troubles due to an update from its editor, quality issues following the redesign of your website: these examples can lead to major issues, and are part of the life cycle of your website.
That’s why you should monitor your web pages over time.
And that’s what Dareboost does the best for you, automatically checking the speed and quality of the pages of your choice!
You will then receive by email a weekly report of major metrics and events (regression of the quality, loading delays on the page, etc.).
Moreover, you can access at any time to a complete history of your website, to see the results of your optimization efforts, or measure the effectiveness of your investments.
Finally, the tool allows you to set the goals to meet for each page (perfect for those who already work with performance budgets). During an automated analysis, we check that these goals are reached. In case of failure, you immediately receive an email alert, with the detailed information.
dareboost.com is also the guarantee to comply with the latest technical best practices for performance, SEO, security and quality!
Web Page Monitoring Configuration
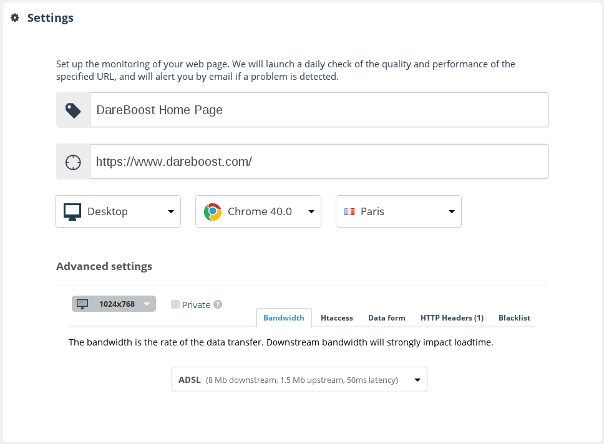
To set up a monitoring, simply click on the “Monitor a new page” button from the dashboard, when logged-in.
Give a name to your monitoring (it will be used in the email alerts for instance), specify the URL of the page, then choose the context (location, desktop or mobile test, advanced settings).
Choose the time at which you want the page to be tested every day (don’t hesitate to contact us to monitor your page more frequently!):
Finally, you can enable the weekly reports and be alerted by e-mail when a resource can’t be loaded (error 404, 500, etc).
Submit, and your monitoring is activated!
Web Performance and Quality: setting goals and alerts
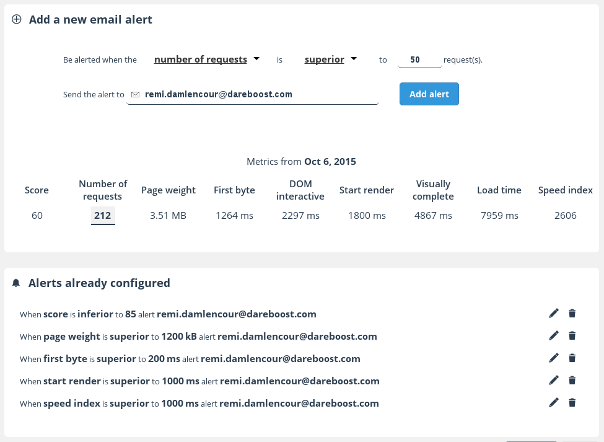
As a second step, you can define the goals of the monitored page.
If one of them is not met, we send an email alert to the address of your choice.
Global quality score, page weight, number of requests, server response time, start rendering time, speed index, loading time… With our last update, you can set alerts for all of these metrics!
Note that alerts can be triggered when a metric is below or above a given threshold. Nothing prevents you to monitor a competitor to be alerted if the loading time decreases or if the quality score increases, for example!
Web Page Monitoring: data visualization
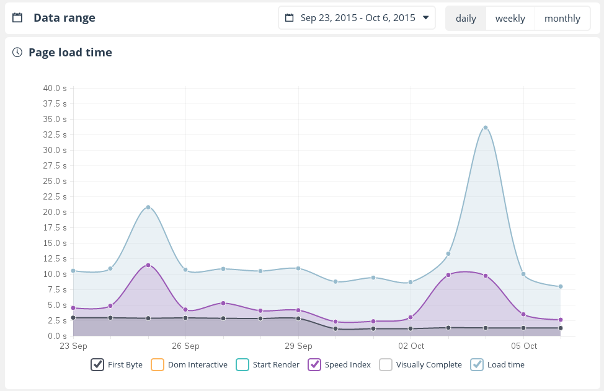
From your dashboard, you access the complete history of your monitored pages. You’ll be displayed several graphs: the evolution of your overall score, the total weight of the page, the number of requests, but mostly performance indicators (server response time, start render, speed index, loading time, etc.) .
For optimal use of your data, you can set the time range to be observed, and aggregate data to identify trends by month, week or day.
As a reminder, all points on our graphics are clickable, allowing you to access at any time to the complete analysis report for a given day!
Finally, we compute changes for key metrics of the page in the last 7 days compared to previous 7 days:
Have a question about the website monitoring feature? A specific need? Please, feel free to get in touch!


