
Web performance, or website speed, is an integral part of web development that pertains to the speed at which web pages are downloaded and displayed on the user’s browser. This process encompasses a multitude of factors such as server response time, network conditions, device type, browser type, and the size and quantity of resources on the web page. A high-performing website, characterized by fast load time and efficient delivery of content, is a testament to effective website design and optimization. Web performance is a complex discipline that involves various elements such as front-end optimization, which focuses on reducing the file size and number of HTTP requests, and back-end optimization, which aims to improve server response time. Other components include network optimization, which targets to reduce latency, and browser optimization, which focuses on enhancing rendering speed. Mastery of these components is crucial for improving web performance, which in turn, enhances user experience and SEO. Web performance is not a static concept; it evolves with the advent of new technologies, tools, and techniques. Regular monitoring and optimization of web performance are essential to stay competitive in the digital landscape. This involves using web performance tools to track performance metrics, identify issues, and implement improvements.
What is web performance and why does it matter?
Web performance, or website speed, is a critical measure of the speed and efficiency of a website. It plays a vital role in determining the quality of user experience and the website’s visibility on search engines. The importance of website speed cannot be overstated. Slow load time can lead to user frustration, resulting in high bounce rates, low user engagement, and ultimately, lost revenue. Web performance matters as it directly influences the user’s perception of a website. Websites with fast load times are associated with professionalism, reliability, and trustworthiness. In contrast, slow websites can damage a brand’s reputation and deter potential customers. Fast websites also tend to have lower operating costs due to more efficient use of resources. Web performance is also crucial for SEO. Search engines, like Google, use page load time as a ranking factor. Websites with faster load times are likely to rank higher in search engine results, leading to increased visibility and more organic traffic.
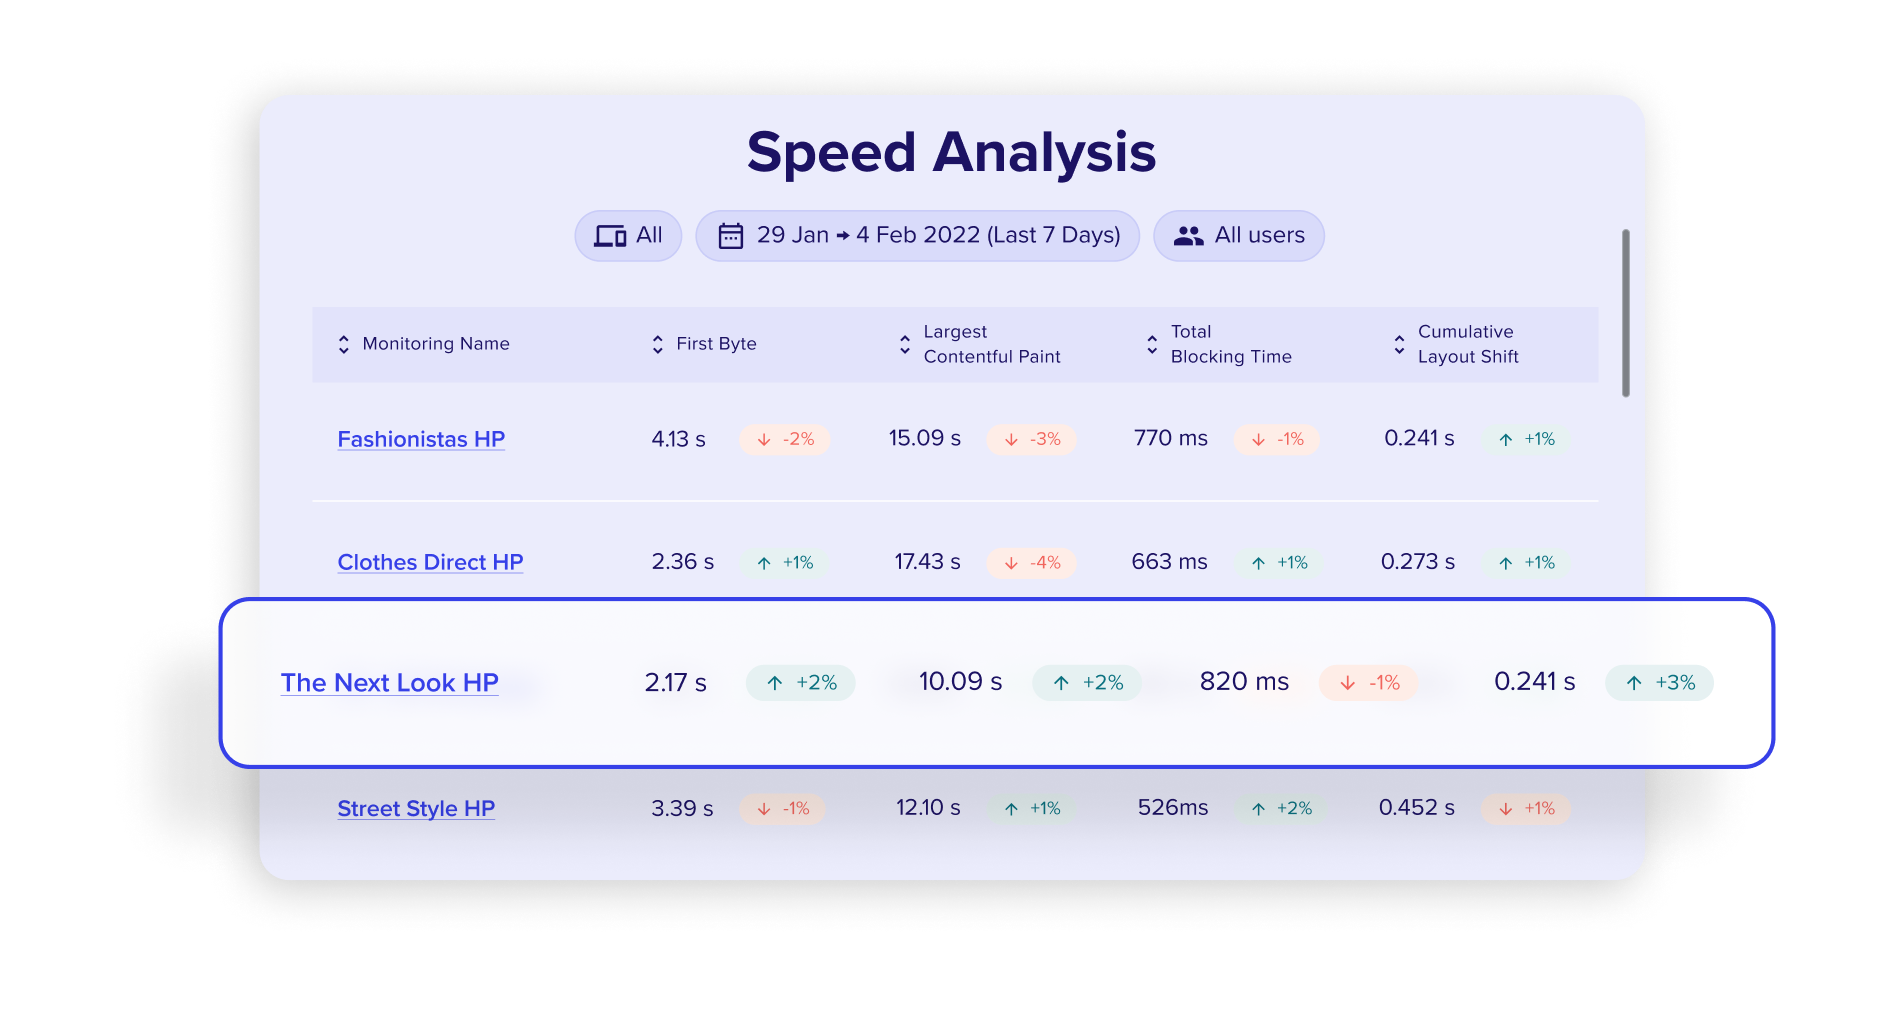
Our 6-minute product shows you how Speed Analysis, part of Contentsquare’s Find & Fix offer can help your business
How does web performance affect user experience and SEO?
Web performance, particularly website speed and load time, significantly impacts user experience and SEO. A slow website can result in a poor user experience, leading to high bounce rates and low user engagement. Users are likely to abandon a website if it takes too long to load, and they may not return in the future. This can negatively impact a website’s conversion rates and overall success. Conversely, a fast-loading website can enhance user experience by providing quick access to information and functionality. This can lead to increased user satisfaction, higher engagement levels, and more conversions. A positive user experience can also encourage users to return to the website and recommend it to others, leading to increased traffic and brand loyalty. Web performance also directly affects SEO. Search engines use page load time as a ranking factor, so faster websites are likely to rank higher in search engine results. This can increase a website’s visibility and drive more organic traffic. Additionally, a high-performing website can improve crawl efficiency, which can also positively impact SEO.
Key elements influencing web performance
Web performance, particularly website speed, is a crucial aspect of web development and design that significantly impacts user experience and SEO. Server configuration plays an integral role in determining load time. A well-configured server can expedite server response time, efficiently handling multiple requests and thereby enhancing website speed. On the contrary, a poorly configured server can drastically slow down a website, negatively impacting the user experience and SEO. Website coding, specifically HTML and CSS, is another vital element that influences web performance. Efficient coding can minimize the size of a webpage, thereby enhancing the load time. In the realm of web development, it is imperative to ensure that the coding is efficient and streamlined to optimize page performance. The number of HTTP requests a webpage sends and the optimization of images are also key factors that affect website speed. Each HTTP request increases the server’s workload and consequently, the load time. Therefore, minimizing HTTP requests is a key strategy in web development for improving web performance. Similarly, image optimization, through techniques such as image compression and lazy loading, can significantly reduce the size of a webpage, thereby improving its load time. Content Delivery Network (CDN) utilization is another critical factor in web performance. A CDN is a network of servers that deliver web content to users based on their geographical location. Effectively utilizing a CDN can significantly enhance server response time, thereby improving website speed, user experience, and SEO.
What role do images and HTTP requests play in web performance?
Images and HTTP requests play a significant role in web performance, impacting both website speed and user experience. Images, particularly unoptimized ones, can substantially slow down a webpage, negatively affecting load time and consequently, SEO. Each image on a webpage sends an HTTP request to the server to fetch the image data. Larger images require more data to be sent, thereby increasing the load time. Optimizing images is a key strategy in web development and design for improving web performance. Techniques such as image compression and lazy loading can significantly reduce the size of images without compromising their quality, thereby enhancing website speed. Image compression reduces the amount of data the server needs to send, while lazy loading delays the loading of images until they are needed, thereby improving the initial load time of the webpage. HTTP requests are also crucial in web performance. Each HTTP request that a webpage sends increases the load time, thereby slowing down the website and negatively impacting user experience and SEO. In the realm of web development, minimizing HTTP requests is a key strategy for improving web performance. Techniques such as combining files, using CSS sprites, and implementing AJAX can significantly reduce the number of HTTP requests, thereby improving website speed and enhancing user experience.
Our 6-minute product shows you how Speed Analysis, part of Contentsquare’s Find & Fix offer can help your business