More and more of you were asking for it, so we did it :)
Comparison Tests are now available!
- Would you like to know how your website is doing compared to a competitor, whether it is a challenger or the leader of your market?
- Would you like to valorize your optimization work by comparing the new version and the old one of your client’s website?
- Would you like to compare the speed of the mobile and desktop versions of your responsive website?
These are just some examples of use cases of our comparison reports, already adopted by the 400 beta testers that we have chosen!
Now, let’s discover how is structured this report.
Overall comparison about performance and quality
This first area will allow you to associate to each page its global score in a glance. As a reminder, the scores are computed according to the complicance of each page with the checked best practices.
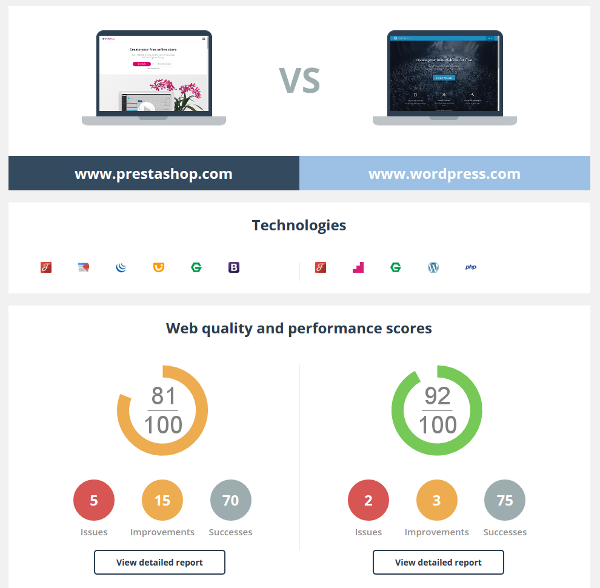
Don’t forget either that the number of checkpoints can vary from a page to another: indeed, DareBoost detects the technologies used by the pages and may control some aspects dedicated to a specific CMS or framework.
Speed test: major indicators
This histogram allows you to find at the very same place the major web performance indicators, such as the response time of the server, or else the Visually Complete, and to easily compare the respective results of each page.
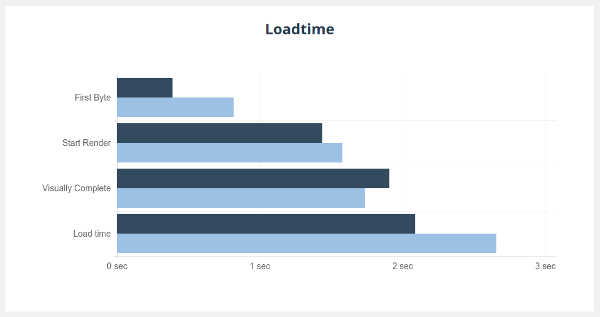
You will also find the SpeedIndex, a very relevant performance indicator to sum up what is going to feel the user of the rendering of each page.
If you would like to know more about performance indicators in relation to the webpage rendering, we wrote a blog post about it some weeks ago: Speed of the rendering of your pages : Start Render, Visually Complete and SpeedIndex.
Videos analysis and filmstrip
After having compared the web performance indicators of each page, you will be able to replay and to analyze the loading of those pages thanks to the video and the filmstrip, and to compare the pros and the cons of each one.
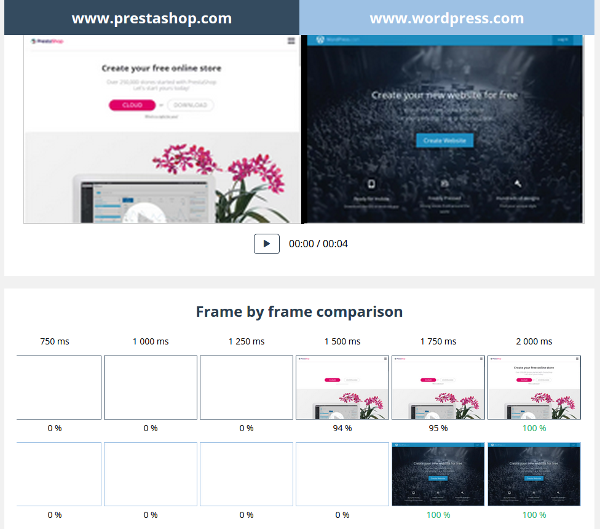
Don’t forget that the total loading time can be very high in some cases, however it doesn’t prevent from an excellent user experience if the important elements and content are promptly rendered!
The filmstrip allows you to visualize in pictures, step by step, the loading of those 2 pages and to compare them. For each step, the visually complete percentage of the area above the foldline is shown. A 100% value means, the Visually Complete is reached: the area above the foldline is then its final state.
Weight by type of resources
In order to allow you to go way further, this area allows you to compare the total weights of the resources for each type of content.
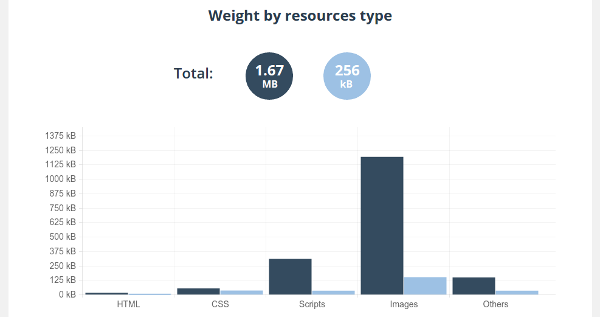
If one of the compared page is over-consuming pictures or javascripts for example, you will be able to see it in a split second.
For instance, it’s very useful to compare the mobile version and the desktop version of a same page, that very often don’t have the same composition at this level.
Make your move, give it a try now!
Don’t hesitate to share your feelings and your experience below in comments !