Some days ago, we mentionned on this blog the various measures which the Performance Timing API provides access.
Today, I offer to you to discover other data required to assess the web performance, more focused on the user’s feeling than on the technical side.
We’re going to talk about 3 metrics, all related to the way your web pages render.
Start Render, Visually Complete and Speed Index have been for a few days available in the speed test of dareboost.com (only in private beta version at the moment – don’t hesitate to contact us if interested !).
Start Render
The blank page syndrome does not only refer to writers. Too often, the loading of a web page faces it too, with a long time before anything appears.
The Start Render gives the time necessary for a first element to render on the page, regardless its size or its importance for the user. This can be a background colour, a text or else, but in every case, a strong sign is sent to the visitor: the page is rendering, operations are in progress and the rest of the content should come.
This a point that must draw your attention. Indeed, before this rendering, the visitor has no certainty about achiving to fully load your page, and if it extends, he could give up on it befor even visualizing a single piece of information!
Technique : how to enhance the Start Render?
The first point, crucial to the start render, is going to be the response time of your server (for instance, think of settlin a cache on it).
Once the source code received, the browser will be able to interpret the source and would be able to be penalized by the JavaScript blocking code that your page would have! As a reminder, it is vital to deport your JavaScript, even to load it asynchronously when possible.
Let’s remind that the CSS recovery is blocking as well. in order to speed up the Start Render, you have to inline the CSSs that affect the immediate visble part of your page (above the foldline) and load what is left asynchronously. If you cannot do this, make sure to reduce the number of CSS files, and to speed up their loading thanks to a CDN if you have an international audience.
Visually Complete
The Visually Complete follows the Start Render, chronologically but also semantically.
Your visitors don’t ask for the page to load fully in a flash, they want a fast loading for the contents and the actions they care about.
It is exactly from this point of view that we are going to consider the Visually Complete, that is going to measure the time necessary to the zone above the foldline to be rendered under its final form. So we are interested in what is immediatly necessary to the user, which means the part of the page available without he needs to scroll.
Technique : how to enhance the Visually Complete?
We have just told it higher, the Visually Complete depends on the Start Render, so let’s begin with that.
Since the idea is not anymore to foster the beginning of the rendering, but instead the whole immediatly visible zone, you need to identify those contents and favour them to speed up their rendering (inline your logo in basis 64 for example).
Be careful on this matter: the Visually Complete depends on the user’s resolution, since the placement of the foldline is associated with it!
NB: the Visually Complete can be affected in some cases, for example in the case of a video automatically triggered or of an animation on the top at the page.
At last, in some case, it is absolutely coherent to not reduce the Visually Complete, since it could finally prejudice the user experience. For example, it would be absurd in most cases to block the rest of the rendering of the page to load a sharing social network widget, even if it is located above the fold.
The Speed Index provides additional support to minimize this kind of effects.
SpeedIndex
Until now, we talked about how important it is to quickly start to display the page, and to display the part above the fold as a priority.
But let’s take the example of those 2 filmstrips:
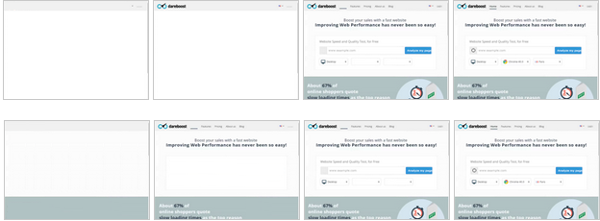
Obviously, although the Start Render and Visually Complete are significantly similar, it is right to think that the second version is a lot better in terms of user experience.
Those 2 times are important, but a major piece of information is missing: how does the page behave during the time between them? Is the majority of the contents displayed straight after the Start Render, or on the contrary, are they displayed just before the Visually Complete ?
The Speed Index is an index that will allow us to sum up those behaviors!
Here is a graph representing the rendered proportion of each page through time.
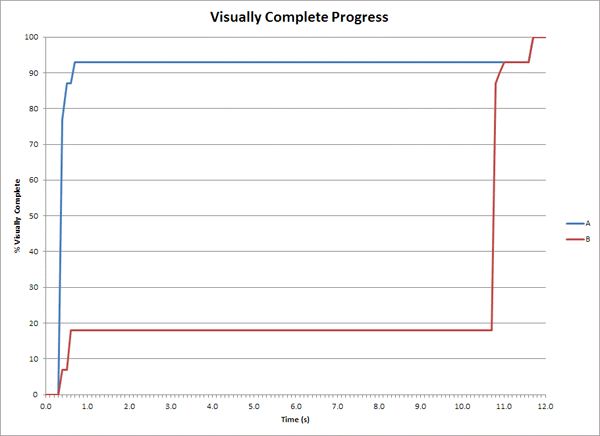
Start Render and Visually Complete have identical values but between them, the situation is not comparable!
After one second, the page A is rendered to 90% whereas only about 20% of the page B is at the same very moment!
The Speed Index calculation is based on that representation to translate this major difference (we calculate it from an integral on the proportion of the page remained blank through the time, you can read this article for a detailed explanation).
Here is a small reference point you should have: to follow the Google recommendation of a Visually Complete under 1 second, your Speed Index must be inferior to 1000. The faster your rendering is, the smaller the Speed Index will be.
Technique : how to enhance the Speed Index ?
The Speed Index depending on the Start Render and the Visually Complete, you’ll need to make the optimizations we talked about earlier. You’ll have to optimize the priority of the loadings in the duration between those values. We talk about the optimization of the critical path of the rendering.
Other actions are possible to enhance the Speed Index and the user experience: for example, you can put in background the dominant color of the slowest elements to load with your CSS inline. For example, you can put a black background for a picture which black is the dominant color, in order to visually “book” the space during its loading. Thus, you build the page template before the resources are even downloaded, and the rendering will be more pleasant to the user.
To conclude, those 3 performance metrics must be at the core of your concern, and are relevant indicators to integrate your performance budget. Thanks to dareboost.com, you’ll be able to easily identify the possible optimizations by analyzing your website !