As Dareboost is one of the 40 selected startups coming from 15 countries by DiG Publishing to present their services to 120+ leading european publishers, we have decided to test the web performance of some of those top news medias and vertical websites with large audience before going to Lisbon. Here are the detailed results.
Now that DiG Lisbon 2017 has just begun, it is time for us to publish the results of this exclusive study!
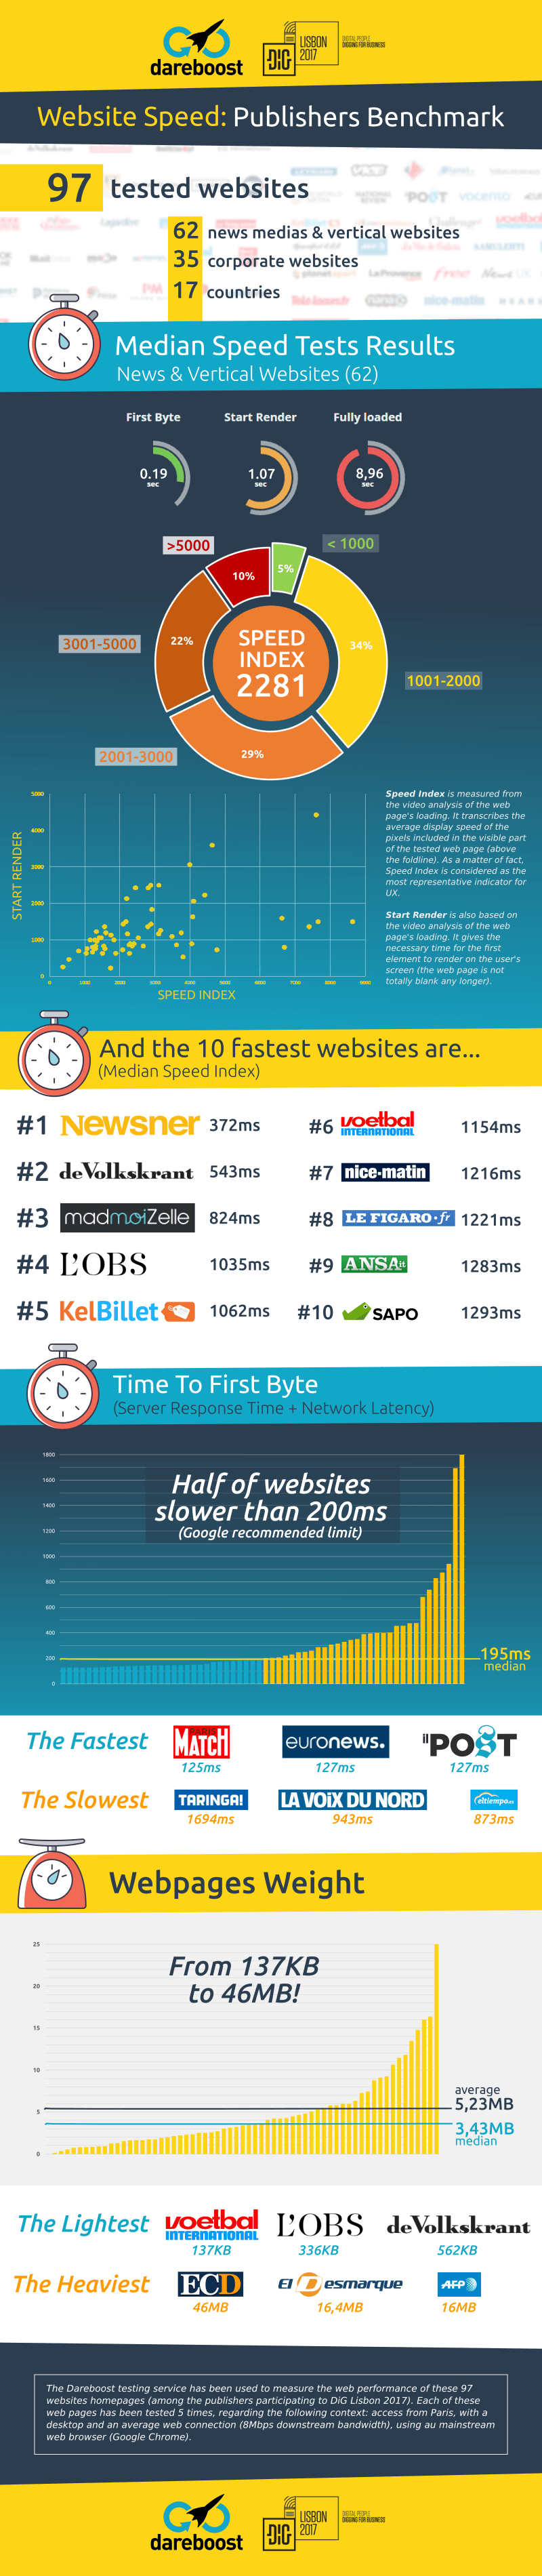
The Dareboost testing service has been used to measure the web performance of 97 websites homepages – according a list provided by DiG Publishing. This list was composed of 62 news medias & vertical websites and 35 corporate ones. We have then focused our tests on the most populated category. Each of the 62 web pages have been tested 5 times by the Dareboost probes, regarding the following context: a french visitor (located in Paris), browsing the web page via a desktop with an average web connection (8 Mbps downstream bandwidth with a 50 ms latency) and using Google Chrome web browser.
Beware so: even if we prevented from gathering punctual measures that could not be representative of the average by testing each web page 5 times, the current results are still an instant picture of the performance of each website. Quite an interesting information but keep in mind that website speed never stops changing. Particularly dealing with websites being monetized with ads. If you need a better oversight of a website performance, you will have to monitor it!
That said, here are the main results of our benchmark:
Speed Index: one third of the website beyond 3 seconds
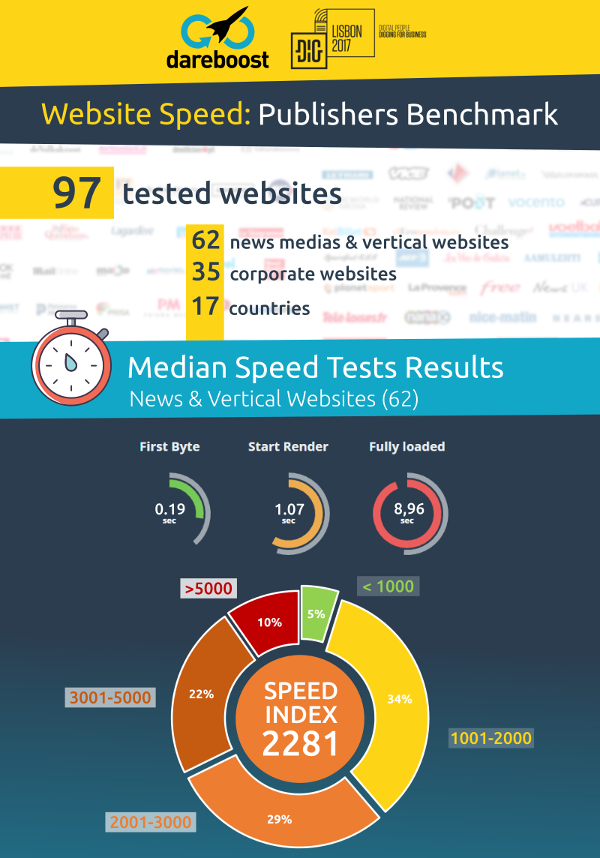
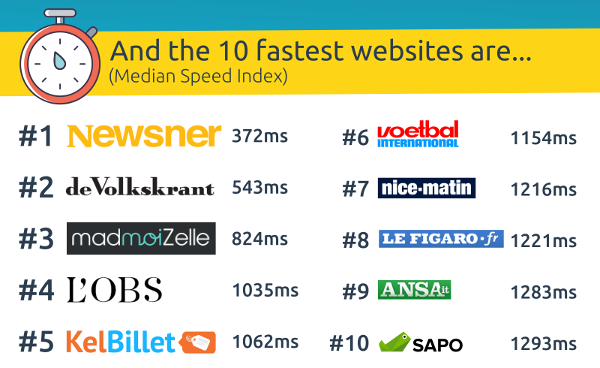
As we usually do within our competitive benchmarks regarding web performance, we have considered the Speed Index as the main ranking criteria. For one simple reason: Speed index is actually considered as the most relevant speed indicator to translate the user experience (UX). Computed from the video analysis of the web page’s loading, this indicator transcribes the average display speed of the pixels included in the visible part of the tested web page (above the foldline). With two landmarks to properly interpret it:
- The lower Speed Index is, the fastest is the website
- One Google recommendation: a Speed Index lower than 1000ms
Regarding the current results, you will notice that only 5% of the tested websites did respect the Google advice, while almost one third of them are beyond 3 seconds. And 10% are even slower than 5s!
Time To First Byte: Half of the website slower than 200ms
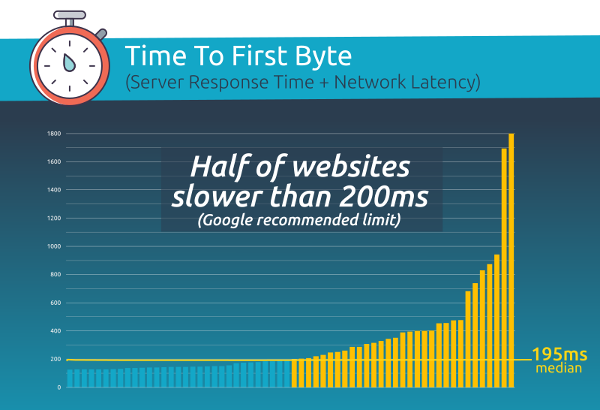
Here is another strategic metric we have measured: Time To First Byte. One more technical indicator that drives a strong impact on the overall web performance and could even influence SEO (as a bad TTFB could reduce the number of indexed webpages by Google robots). In matter of TTFB Google recommends not to exceed 200ms… Our current benchmark reveals indeed that half of the tested websites are beyond this limit!
Median Page weight: 3,4MB!
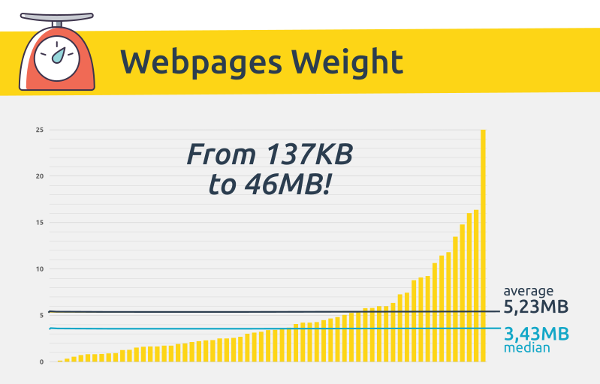
The web page weight is another usual weakness – or optimizing opportunity depending on the point of view! – when we talk about websites performance. The median weight has been measured at 3,43 MB! Really too heavy for major websites driving large traffic.. And visitors that may not all benefit from a fast web connection with a huge bandwidth!
Let’s have a look to some other recent statistics, gathered by httparchive.org:
The average page weight of the Alexa Top1000 websites is actually 3566kB… But it falls down to 1827kB when we consider the Top100 websites! The 62 websites panel of our benchmark should definitely get closer to this stat!