The simplicity of use of Dareboost is frequently highlighted by our customers. After working with dozens of them to get valuable feedback, we’re very proud to announce a new release of our User Journey Monitoring (Scenario) feature. Let’s discover why and how you should start using it to better monitor your Digital Customer Experience!
Quick intro to User Journey Monitoring
As you may know, Dareboost offers various synthetic monitoring features. In other words, with our product, you can monitor any web page, to get performance test results and insights about your websites. We’re offering Real Browser Testing (Chrome based) and all the advanced settings you may need to emulate your real visitors according to their main characteristics (location, bandwidth, mobile device, etc), making sure to get relevant and reliable measurements.
Monitoring web page performance is crucial for a business. However, you need to go further to truly impersonate real users, because they experience your site not as a succession of independent, stateless pages, but as a continuum of actions and interactions. So you need to monitor a whole transaction. Said otherwise, you need to measure the performance of every single step of a conversion funnel, of the key interactions of your customers.
That’s exactly what Dareboost offers. Without any installation and easy-to-be-configured. The User Journey Monitoring feature allows you to test and monitor your most strategic web scenarios: e-commerce funnels, sign-up processes, extranet areas usage and way more. Whatever is your business, Dareboost will match your needs, whatever the technologies your website is based on, and no matter how complex the journeys may be.
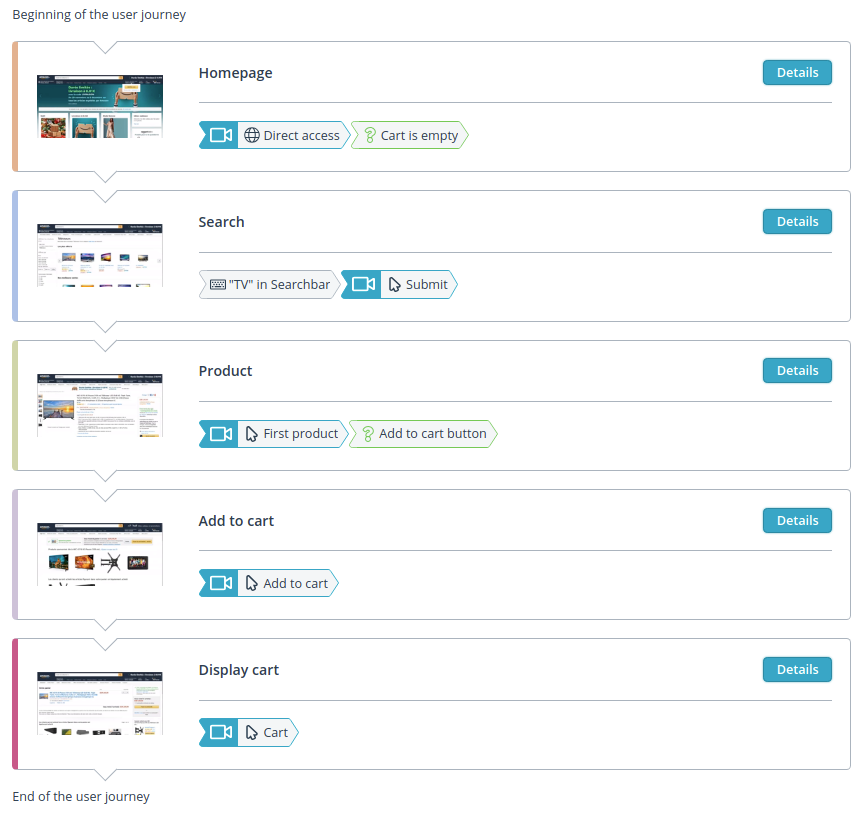
As an example, here is a typical User Journey for an e-commerce website (here, Amazon), from the homepage to the cart:
Before detailing our User Journey feature in the next paragraphs, here’s a quick overview of its key benefits:
- No installation nor modification required on your website
- More than 13 collected performance metrics
- Video replay for every execution and steps
- Up to 12 steps per scenario, unlimited user interactions(clicks, form filling, etc.)
- Execute your scenario at any time in one click
- Real-time updates without maintenance costs: we’re empowering our customers by giving them the ability to update their scenarios at any time
- Out-of-the-box functional testing (assertions) abilities
- Alerts and Performance Budgets
- Interactive Waterfalls for all steps
- Custom Timings (User Timings API) support
- 100% available through our API
Browse & analyze User Journey monitoring data
The main screen of a monitored user journey gives you the main trends of the last 7 days at a glance but also gives access to a stacked graph matching the different steps of the journey performance results through time. All the web performance metrics are available through a drop-down: server response time (TTFB), Speed Index, Start Render, and so on…
At Dareboost, we’re using our own User Journey Feature to make sure our service is as fast as it should be for our customers. Above are the results of a simple scenario of a user login-in from the home page and accessing his reports.
You can click on any step name (from the graph legend) to hide it, helping you to focus on the steps of your choice. The scale of the graph is automatically adapted for better reading.
Some similar graphs are also available for steps weight and number of requests, allowing a breakdown by content types.
And of course, you can adapt the time range, aggregate the data (by days or weeks for example), or again chose the aggregation method (medians, percentiles, etc).
Feel free to check our User Manual for more details about this view.
By clicking any point on the graphs, you can access the detail report of the given scenario execution.
User Journey Execution Report
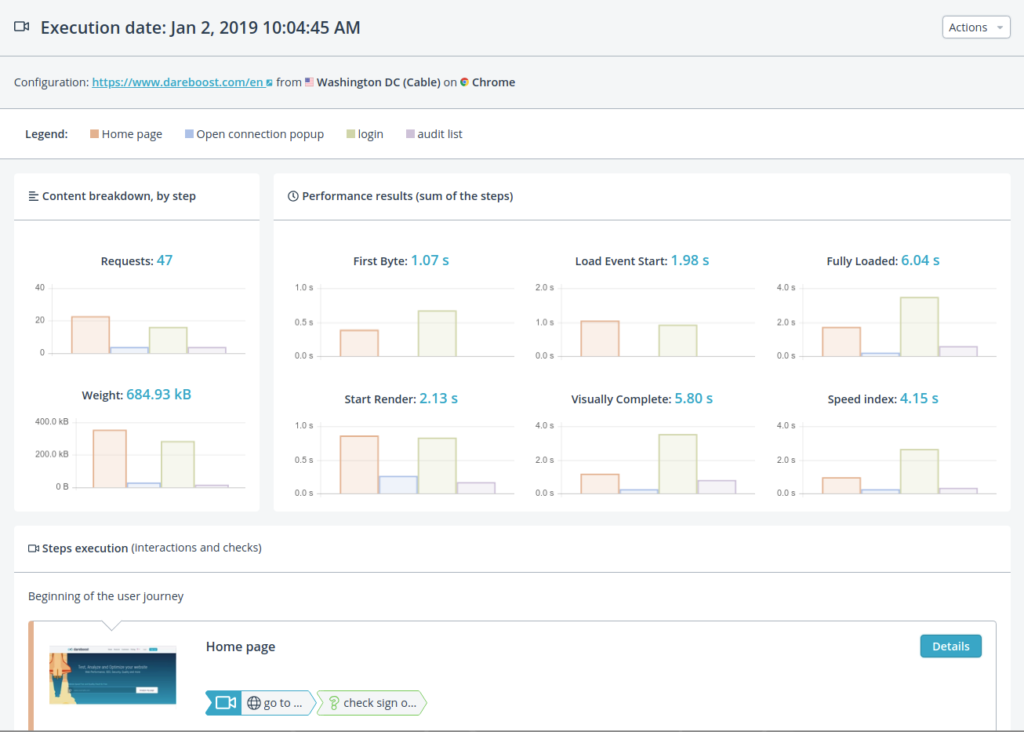
The execution report consists of 3 main parts:
- Several histograms for a step-by-step breakdown of the content (number of requests, weight) and web performance metrics (First Byte, Start Render, Fully Loaded and Speed Index). For every metric, you will be able to get both the value related to a step and the cumulative value, for all the steps.
- An overview of the executed steps and defined user interactions with your website. Actions, successful and failed checks are properly highlighted to ensure that you can effectively analyze any problems that may occur. “Details” button gives you access to the detailed report of a step execution.
- A step-by-step filmstrip, giving a visual breakdown of the loading of your tested scenario, frame after frame, at regular intervals. To each frame is also affected a visual progress ratio.
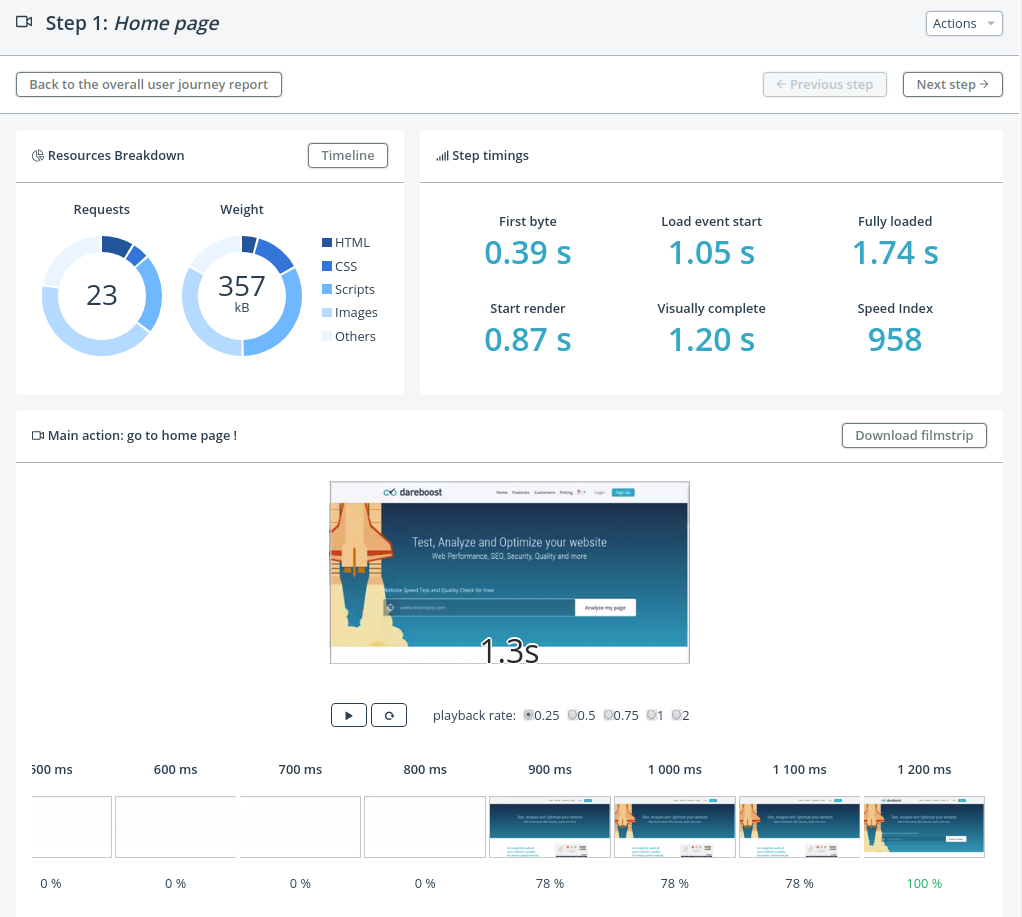
Detailed report of a step execution
After a summary of the step performance results, you’ll find a video player to replay the loading of the step, as well as a filmstrip.
After that, you’ll find a useful summary of the web browser console output: requests in error and/or Javascript execution errors.
Then, an overview of the executed actions (interactions as well as assertions) of the step, with their related statuses, is available.
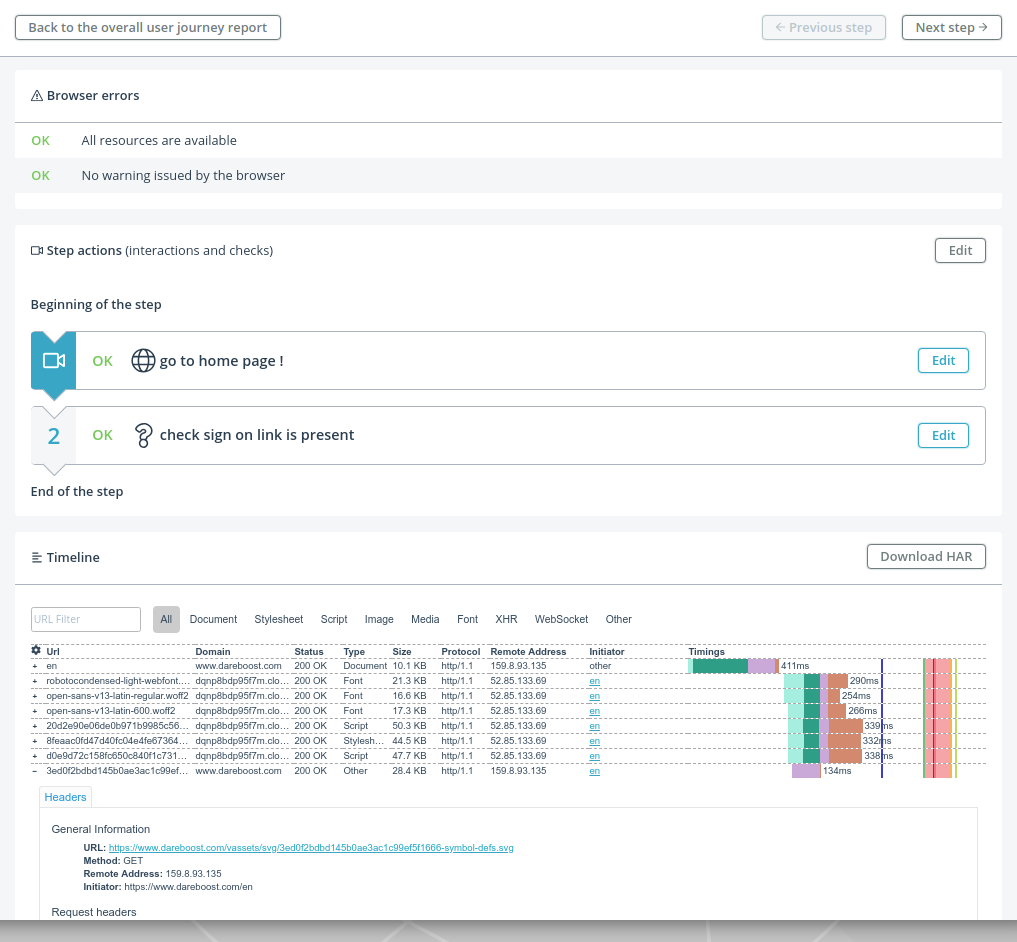
Finally, you can explore the interactive waterfall of the step for an advanced analysis or again download the data as a HAR file.
Performance Budgets to the next Level
Dareboost helps you ensure the compliance of your web pages with your Performance Budget. Through our alerting system, you can define your own targeted value, triggering an alert in case this value is higher than your threshold.
This alerting system is available with an additional granularity level for User Journeys: either you can define your budgets for cumulative values (the whole scenario execution) or you can define them on given steps. Of course, you can benefit from both methods in the same User Journey!
Here are some examples of budget you can set for a same scenario:
- “My home page should be less than 1MB and my whole scenario should need less than 5MB to be downloaded”
- “The “Search” step of my funnel should have a TTFB under 200ms and the sum of TTFB of all steps should be under 1200ms”
- “The total number of requests of my scenario should be less than 300.”
- etc.
For each defined threshold, you can also configure the recipients for the alerts to be sent (maybe you want a given team to know about page weight issues, whereas another team would be responsible for the backend time).
Create and Maintain Your Scenarios
Dareboost’s mission is to empower people for faster websites. Contrary to some other services, you won’t depend on our support to create and maintain your scenarios. Our business model is to offer a product and to help you to make the best of it.
Thanks to a dedicated interface, your own team can create and update scenarios in total autonomy. And they can do it in real-time. Of course, our Customer Success team will be available at any time if you need help.
You’ve released a new version of your website with an upgraded version of your conversion funnel? You won’t have to wait hours or even days for your User Journey monitoring to work again. Update your scenario on Dareboost, save the changes, and that’s done.
You’ve enabled an A/B test in your funnel affecting your User Journey monitoring in a way you would like to avoid? Edit the configuration of your scenario in order to prevent your A/B testing service to trigger the change, for example by adding a cookie in your configuration.
You want to check the performance results of your staging website? Duplicate your existing scenario in one click, and change the first step to start the navigation of the journey on your staging website, and that’s done.
Free trial, get in touch!
This brand-new tool is now available. Pricing depends on the number of steps, the frequency(ies) and the underlying base subscription. Do not wait any longer get in touch and request a trial.