To keep going further in the assistance to the diagnostic process, and to offer you a clear vision of your performance history, we just set up a new dashboard. This section -directly accessible after you log in– has entirely been reworked!
It now includes new data (page weight history, number of requests, etc.) in a more user-friendly interface. We also offer new features, for instance, you can now bookmark your favorite monitored pages.
Let’s give a closer look at the specificities of this new dashboard:
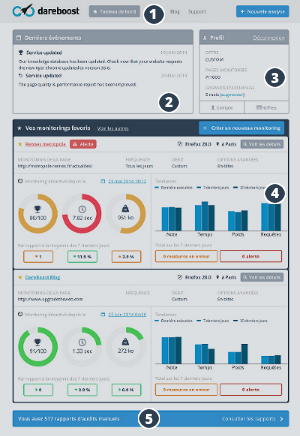
| 1 – A more efficient menu: when you log in to DareBoost, you get access to a new menu. Your dashboard and the analysis form are now available at any moment! |
| 2 – The service latest events: DareBoost is always evolving, and new best practices are very frequently included. Your score, for instance, can be impacted, that is why we keep you informed of all changes.
3 – A direct access to your profile settings: keep an eye on your quota, and access your profile or invoices easily. 4 – A new section dedicated to the website speed monitoring: you can now bookmark as favorite your most important monitorings. It shows an overview of the principal data and the most important information. We added new charts, which show average figures for the last 7 days and the last 30 days, and that you can compare easily with your latest analysis. |
| 5 – An access to your stand-alone analyses: at any moment you can browse the reports you generated by launching an analysis manually. |
Log in or create an account now, to enjoy our website analysis tool!
Do you like what we did? Do you have any suggestion? Share your opinion! You can leave a comment here, or contact us via Twitter or Facebook.
