Every month, DareBoost relays the data published by HTTParchive.org and gives you information on the current situation of the web, highlighting the most significant data. This article gives you the figures of July, 1st 2014, bringing out the recent evolutions, and comparing these data to those of 2013 in the top 1 000 most visited websites.
Number of 4xx and 5xx errors reached historic peak!
The major news of this July 2014, regards 4xx and 5xx errors, they have indeed reached the highest frequencies we have ever seen! In the top 1 000 most visited websites, 20% of the pages include one or several unreachable resources!
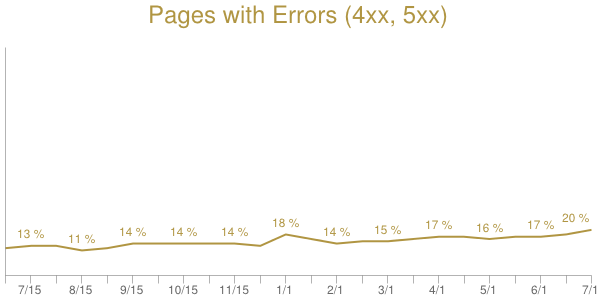
Errors like the well-known 404 error are increasingly frequent. As shown in this graph, the curve tends to go up: +8 points in one year. And even more noteworthy, this figure has doubled since 2012 (it was 10%)! Given this trend, we can wonder if the record will be again broken in August. We will follow this figure closely!
As we reminded last month, “these errors can affect the pages in various ways: from an imperceptible impact, to a total impossibility of using the website.”
Vérifiez maintenant si votre propre site ne comporte pas ce type d’erreurs, en lançant une analyse de votre site web !
Don’t hesitate to quickly check if your website contains this type of errors, by launching a website analysis!
Average page weight increased by 8,7%
In the article of the last month, we stated that between June 2013 and June 2014, the pages’ weight had increased by 16%. With no surprise, pages became weightier: indeed, we can see that pages weight has increased by 8,7% compared to the last month figure, from 1492kB to 1622kB.
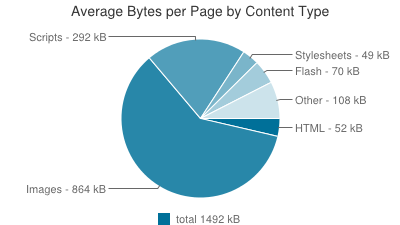
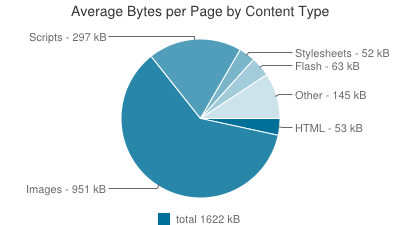
June 2014 July 2014
We can notice however that the share of the different types of resources did not change a lot.
At this 1st July, images represent 58,63% of pages weight, which is still by far the most significant part of the content. This is an opportunity to remind how much images deserve attention. It is essential to optimize them, in order to offer visitors the best browsing experience.
39% of the resources are not cached
Cache lifetime is a very important factor in terms of page load time.
Indeed, cache allows users to save numerous resources on their browser. In doing so, the number of required exchanges on the network is reduced after the first visit. This implies very substantial potential savings.
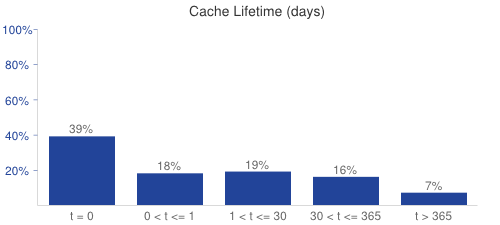
39% of the resources are never cached, and will never enjoy the benefits of cache mechanism.
It has to be noted that all the resources cannot be cached (for instance, dynamically generated HTML) and some constraints can prevent from using cache.
We can observe that there were no major changes during the last years, regarding the cache lifetime. For instance, on the 1st July 2011, 41% of the resources were not cached.
Comparative summary of the figures:
Over one year:
| July 2013 | July 2014 | Evolution % | |
| Total weight | 1246 kB | 1622 kB | +30,2 % |
| Number of requests | 100 | 112 | +12,0 % |
| Images weight | 668 kB | 951 kB | +42,4 % |
| TCP Connections | – | 42 | ND |
| Domain number | 19 | 23 | +21,1 % |
| Max requests on 1 domain | 40 | 42 | +5 % |
| Cacheable Resources | 61 % | 61 % | +0 % |
| Sites with custom fonts | 18 % | 42 % | +133,3 % |
| Sites using flash | 40 % | 35 % | -12,5 % |
| Pages with error | 12 % | 20 % | +66,7 % |
| Compressed responses | 79 % | 85 % | +7,6 % |
Over one month:
| June 2014 | July 2014 | Evolution % | |
| Total weight | 1492 kB | 1622 kB | +8,7 % |
| Number of requests | 108 | 112 | +3,7 % |
| Images weight | 864 kB | 951 kB | +10,1 % |
| TCP Connections | 41 | 42 | +2,4 % |
| Domain number | 22 | 23 | +4,6 % |
| Max requests on 1 domain | 42 | 42 | +0 % |
| Cacheable Resources | 61 % | 61 % | +0 % |
| Sites with custom fonts | 41 % | 42 % | +2,4 % |
| Sites using flash | 36 % | 35 % | -2,78 % |
| Pages with error | 17 % | 20 % | +17,7 % |
| Compressed responses | 85 % | 85 % | +0 % |
To know how your website is situated among all these metrics, you can launch a website speed test with DareBoost. You will be given numerous personalized tips for an in-depth optimization of your website!
Moreover, don’t hesitate to follow us on the social networks, Twitter, Facebook and Google+, and be informed of the latest news, regarding web performance.
What does ‘ko’ stand for? I have been researching about the page weight since a last few days and one of the webpage analysis site also gives the page weight in ko but can’t figure out anything about it.
Thanks
oups!
‘ko’ is french for ‘kB’, I’m going to fix that!