One year after the launch of DareBoost.com, our performance and quality reports are getting a makeover! Thanks to your feedbacks, after more than a million pages analyzed, we have integrated many new features to these reports!
We offer you to discover the detail.
An overview in a glance
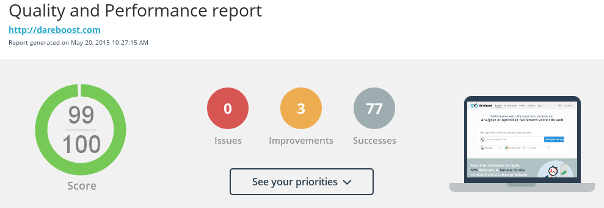
As before, the score given by DareBoost is the first element of the report, and allows you to have a quick idea of the technical quality of the analyzed page. Then, we made the choice to put even more forward the different checkpoints applied, thanks to the highlight of the number of issues and suggested improvements. We take this opportunity to remind you that all of these checkpoints have a coefficient, according to their significance, allowing us to compute the global score of the page.
Asked by many of you, a direct access to the recommendations of the reports has been created: “See your priorities”.
Area dedicated to performance metrics
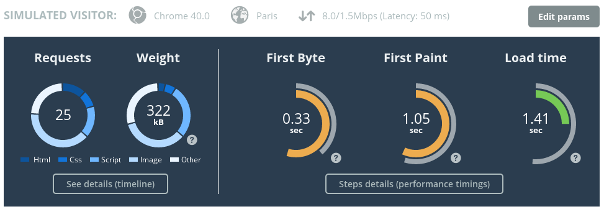 This second area has been entirely reorganized and largely enriched.
You will find, as before, the weight of your page and the number of requests that compose it. We added for each of these values the repartition according to the resources types. A new access to the timeline (or waterfall), more visible, has also been imagined.
Two new information come to complete the total loading time of the page, present in our former version of our performance reports: the delay before reception of the first byte by the browser and the delay before the first paint of the browser, meaning the beginning of the page rendering.
Once again details are available, with an access to the “Performance Timings”, that the most experts among you will be glad to find!
W3C Validation and browser console
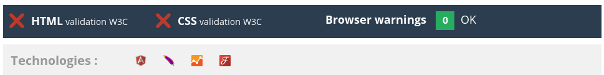 Lot of you do like the presence of the W3C validation directly on DareBoost. You are still able to check if your page matches web standards and to access to the details. We have added the “Browser Console” feature, that points at the issues encountered by the web browser (JavaScript issues, infringement of the defined security policy…).
This report aims to give you the metrics allowing to assess in a glance the performance and the quality of your web pages, while offering to the developers an access to alle the details essential to your pages’ optimization.
We hope you’ll like these brand new features! Don’t hesitate to react in the comment section below.
As a reminder, you can also download our reports in PDF format, and available in white label unlimitedly from our Premium subscription!