We may be Web Performance experts, we still don’t have superpowers . We also need tools to analyze our sites and applications. So when we released our new Custom Timings feature, we naturally jumped at the chance to test it on Dareboost.com… and immediately saw the benefit.
A few weeks ago, we have introduced a new feature in your page analysis reports and monitors: Custom Timings, tailor-made markers, to be placed in JavaScript using the User Timing API, that you can then display in Dareboost to visualize their evolution over time.
We’ve chosen to prioritize this feature within our backlog because we were deeply convinced that it would allow our customers to better understand their websites performance. In fact, using it is so simple that we immediately found a practical application to meet our own needs!
To explain this, let’s take a look under Dareboost’s hood first.
Dareboost: an AngularJS application personalized according to the current user’s rights
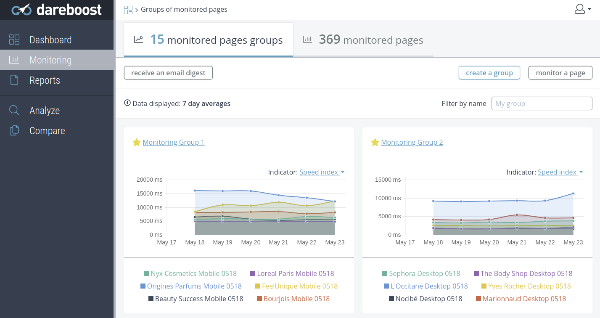
Any visitor consulting Dareboost website uses a real Web Application. In other words, the user’s browser loads JavaScript code that, once executed, takes over the browsing experience and emulates the behaviour of an application instead of the navigation between multiple web pages. For example, a user can switch from one screen to another without reloading the side menu.
To ensure this applicative behaviour in a web page, known as SPA (for Single Page Application), we use a JavaScript framework: AngularJS. This framework performs the customization operations, using an XHR request (XMLHttpRequest) to retrieve the user’s context.
Two shakes of a lamb’s tail
We decided to set up several Custom Timings:
- When AngularJS begins its bootstrapping:
angular_boostrap_start - When AngularJS is bootstrapped (and starts doing what we want him to do to present Dareboost’s interface):
angular_boostrap_end - When we ask Angular to fetch the current user’s context:
userinfo_xhr_start - When the context is effectively recovered:
userinfo_xhr_stop - When the content is displayed in the main area:
view_content_loaded
Setting up these marks is so simple that some customers ask us if these are really the only actions to take. Check it by yourself: once you have found which portion of code corresponds to the behavior you want to monitor, just add this code:
performance.mark("angular_boostrap_start");
We really had nothing more to do for Dareboost to start collecting these new data: no particular configuration, no declaration, or anything else. A few days later, we consulted our monitoring data and the data were available. We didn’t expect such results*!
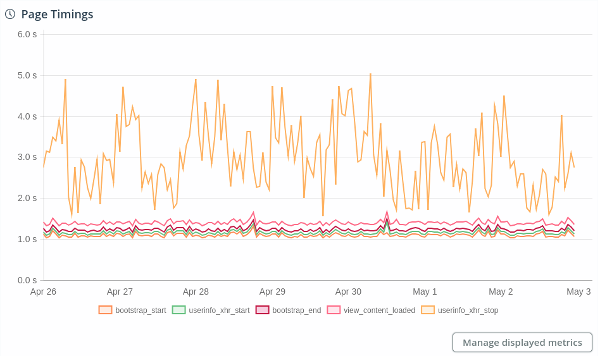
Erratic timings for the userinfo_xhr_stop mark
* In fact, we did, because we already had experienced slowdowns several times, in a significant way. But seeing them on a plot is something else.
Elementary, my dear Watson!
What’s going on? The AngularJS booting phase, marked by the events angular_boostrap_start and angular_boostrap_end, is quite obvious. But, surprisingly, we find the context request in the middle. Actually, this is only fair: the context request and loading of AngularJS are asynchronous but, in reality, depend on each other. Indeed, the request must wait until AngularJS is loaded to be initiated. If we want a finer follow-up of this request, we will surely need to move this marker so that it better meets its purpose.
The Custom Timing of the main area comes next, which is reassuring in Dareboost’s ability to respond quickly to user demand since it is mainly in this area that he looks at.
Finally, we see the Custom Timing of the context request response, which is unsteady and bad: almost two seconds for context recovery. Two seconds of latency is quite a long delay for a busy user! Analyses that refuse to start, potentially unavailable scenarios (because they did not have the item on the menu)… we had to fix it quickly.
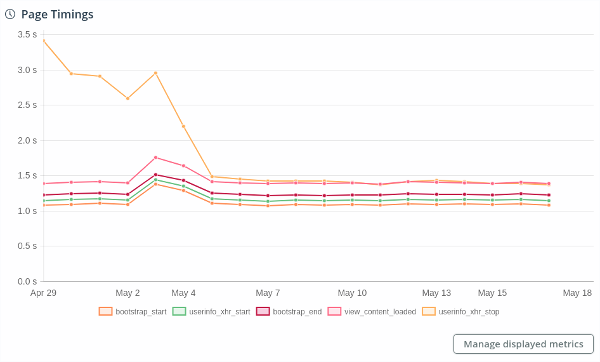
Immediate action by the development team solved the problem
Fortunately, the team promptly identified the back-end side issues that could explain the delay. After a minor release, the situation clearly improved:
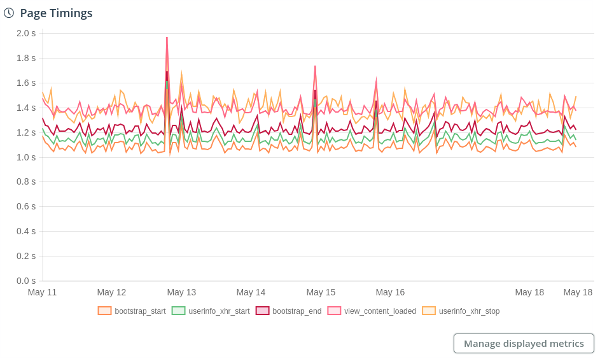
This is how Dareboost performs now
The situation has returned to a normal behaviour, with the main contents appearing simultaneously with the determination of the user context.
In a nutshell
- Setting up Custom Timings takes a few seconds and does not require any special configuration in Dareboost
- Custom Timings are new indicators to understand what was invisible before.
- Custom Timings are particularly suitable for monitoring the performance of SPAs
- The shoemaker’s children don’t always go barefoot!