It’s been months we have been working on it and testing it with a few renowned customers, and there we are now… Proud to announce the release of a brand-new feature on Dareboost: Synthetic User Journey Monitoring! Thanks to this new service, you will be able to analyze and monitor the web performance of a whole user journey. Let’s discover this new option.
Synthetic monitoring now available for customer journeys with Dareboost
You may already know – or use – our website speed monitoring features, that let you track, without any installation, the loading and rendering times of web page. Bringing the most accurate insights about web performance for marketing as for development, this tool provide a comprehensive dashboard, allow to set alerts to detect the regressions and slowdowns, or to use our data with your usual services and tools through our API.
Until now, our approach was limited to a single page test, making sometimes impossible to reproduce advanced user contexts that would need a transactional approach to do so. But now, thanks to our user journey monitoring tool, you can benefit from all of our synthetic monitoring based features for a whole multi-steps user scenario, whatever the technology your website is based on, no matter how complex the journey may be!
User Journey Monitoring Dashboard
Whether you’re monitoring a customer journey on your ecommerce website or user logging-in and browsing the private area of your website, you will access to this new feature through a new entry in your Dareboost menu to consult your data.
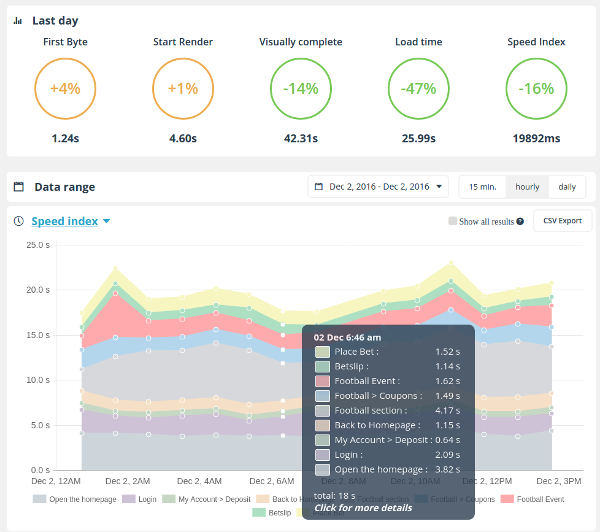
Not only the main screen concerning the monitoring of a user scenario will let you visualize the main trends at a glance but also give access to the stacked graph matching the different steps of the journey monitoring through time.

All the web performance metrics can be displayed : server response time (TTFB), Speed Index, Start render, and so on…
To make data easier to read, you can click at anytime on any step name (from the graph legend) to disable its display, allowing to focus on the steps you’re looking for.
By clicking on one precise item from the graph, you will access to a detailed screen concerning the selected execution of the user journey.

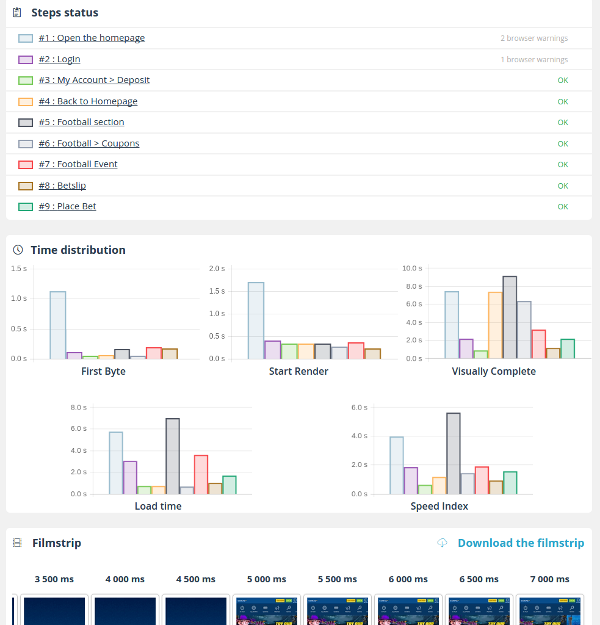
The first area of this page, allow to access any step details, but is also a summary of major events occurring during steps execution. You’ll know about failing steps preventing the whole scenario from being achieved as well as about errors reported in the browser console, or again the failed checkpoints.
Indeed, thanks to this new scenario feature, not only you can monitor the loading time of your conversion funnel, but also define your own checkpoints (eg: to ensure a button or a given text is indeed displayed as expected).
Further on that page you will find the performance metrics shown as histograms, so you can easily identify the steps with the most significant impact.
Below, you also have an access to the global filmstrip of the whole scenario that will let you visualize how the journey has unfolded.
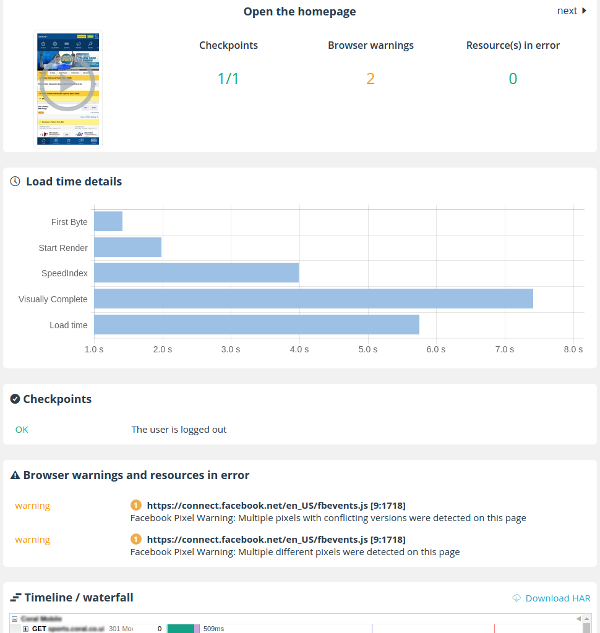
Naturally, you can also explore the detailed fulfillment of each step, replay the video of the page loading, list the checkpoints results or consult the browser errors and warnings.

Finally, you can explore the waterfall of each step of the scenario for an advanced analysis and even download the data as a HAR file.
Alerting on a step or on a whole scenario
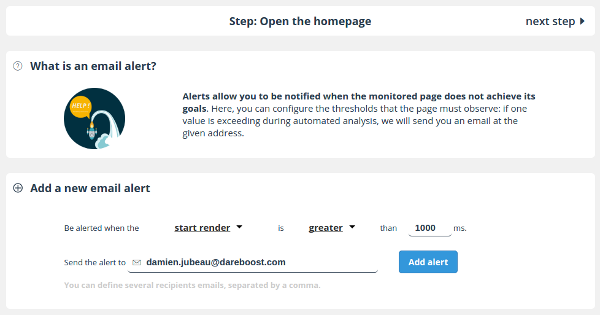
As for our single page monitoring feature, a powerful alerting tool is available within our transaction monitoring service. You can define the thresholds to be observed concerning any of the performance metrics within one or several steps or even the whole user journey.

User Journey Performance Testing and Data Export
Directly from your dashboard, you can trigger at anytime a scenario execution if you need test results without having to wait the next execution. A very helpful option if you have just deployed an update and need to make sure there is no slowdown or that the journey is still working as expected.
You can even go further by automating the scenario execution via our API, that will also allow you to create new custom events, or to access your data to be used with your favorite tools.
Anyway, note that you can export at anytime the data of a user journey as a CSV file.
Ask for a demo!
This brand-new tool is now available from $144 per month (for one journey with up to 5 steps, with hourly monitoring and unlimited on-demand executions), for our former customers as new ones. Do not wait any longer to contact us and talk about your specific needs: sales [at] dareboost [dot] com.
