Custom timings (API User Timing), have just landed on Dareboost! This brand-new range of performance indicators gives a new dimension to your web page analyses and monitors. And that’s not it yet: more advanced indicators such as DomContentLoaded or Onload are now available in your monitoring data… Let’s discover how to use these new performance metrics with our tool.
Custom Timings in your Dareboost reports
We recently presented the User Timing API and the benefits from setting up Custom Timings. Custom Timings are a very simple way to strengthen your performance tracking, by creating specific indicators that will best meet the challenges of your own pages (and without having to install any additional javascript on your pages, since it is a standard API).
Dareboost automatically collects the “marks” declared in your web pages by your developers (using the User Timing API). Using these indicators in Dareboost will not require any extra effort!
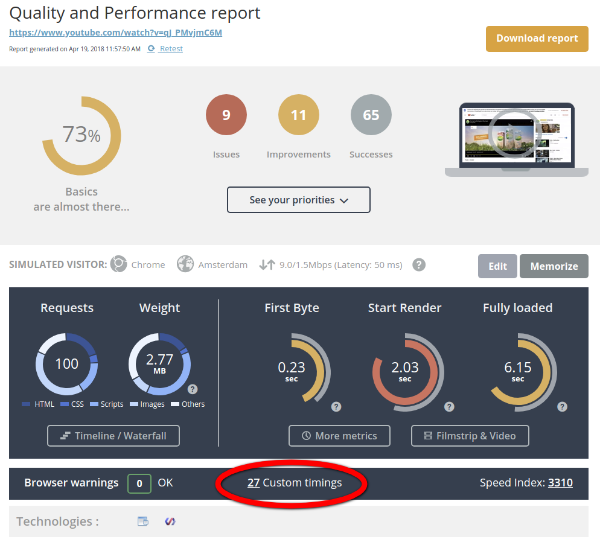
The analysis report shows the number of collected Custom Timings, whatever their type, whether they’re marks or measures (durations calculated between two given marks).
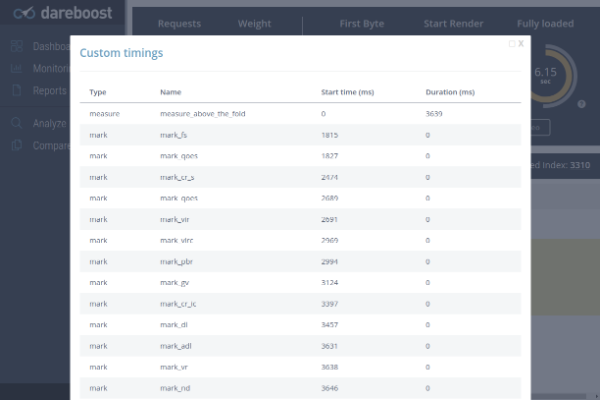
You can then access the complete list of the collected custom timings with their values (expressed in milliseconds).
This screenshot shows that Dareboost has collected 27 different custom timings on this Youtube page… Youtube already uses quite intensively the User Timing API. Beginning with Custom Timings, you may prefer to focus on the measurement of a few customized milestones, chosen to flag the loading of some strategic elements in your own context (the “Hero image”, Launching a video, loading of an external script, etc.).
Dareboost automatically collects your Custom Timings, no matter how numerous they are. We advise you to take care of the naming of your Custom Timings and to use a naming policy for your marks and measures. That will save you time as it will be easier to analyze your data!
Enriched monitoring
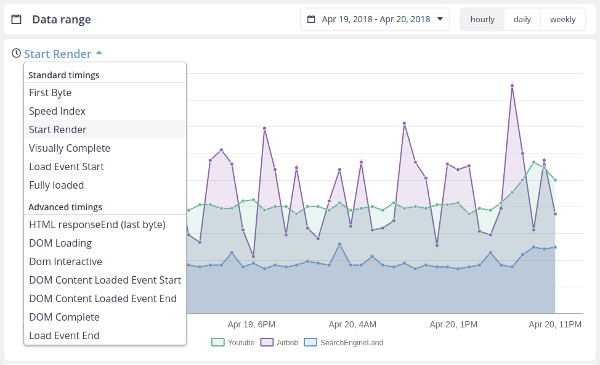
The Dareboost monitoring features also benefit from this update and get significantly enriched. The list of available performance metrics for monitoring extends to 7 new timings! Namely:
HTML ResponseEnd (last byte)
You may already know the Time to First Byte. HTML ResponseEnd is tightly dependent on TTFB by taking into account just one more delay: the time to retrieve the rest of the response, i.e. the time do download the entire HTML code of the web page.
DOM Interactive
This event indicates that the browser has finished parsing the HTML code and building the DOM. Beware of this misleading name: DOMInteractive does not mean that the page is interactive for the user. Moreover, you also have no guarantee that the page is rendered yet (for example, it may be blocked by a script or the loading of a stylesheet).
DOM Content Loaded Event Start
Indicates when the browser triggers the DOMContentLoaded event. At this point, you have the guarantee that the synchronous scripts – and those with a defer attribute – have been executed. The same applies to stylesheets loaded synchronously.
This event is widely used to trigger asynchronous treatments. Many javascript frameworks rely on this event.
DOM Content Loaded Event End
The DOMContentLoaded event is completed. The time between the start and the end of the DOMContentLoaded can be an excellent way to gauge the impact on your performance of the treatments triggered one the DOM Content Loaded event.
DOM Complete
All scripts within the DOM, including those with the async attribute, have been executed. All the page’s resources defined in the DOM are loaded (images, iframes, etc.).
Load Event Start
In most cases, it is equivalent to the DOM Complete. The only additional delay that could be introduced would be caused by onReadyStateChange-based treatments triggered on the DOM Complete.
Load Event End
Indicates when the document’s Load event is completed. The duration of this event relies on the treatments triggered at the onLoad (loading of new resources, etc.).
Therefore, Dareboost now allows you to monitor 13 performance indicators’ evolution… At least. Indeed, you may also have to count the Custom Timings set up on the monitored page!
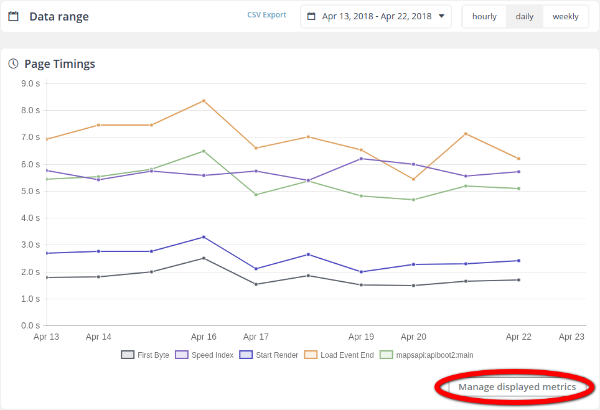
To let you analyze and compare the evolution of all these metrics as you wish, we have upgraded the main graph of your monitoring pages:
By clicking on the “Manage displayed metrics” button, Dareboost allows you to select the metrics to be displayed on the graph.
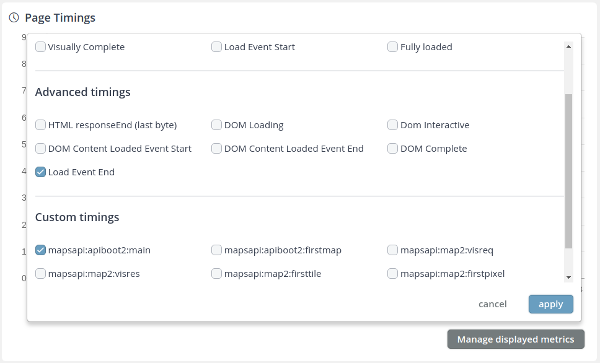
The configuration window gathers all the available metrics: the “standard”, the “advanced” as well as all the Custom Timings that have been collected by Dareboost during the given period. You just have to check the ones to be displayed.
NB: Dareboost has started collecting Custom Timings and some of the advanced timings on 2nd April 2018.
Thanks to this update, Dareboost becomes an even more powerful tool to gather and analyze a very wide range of performance data: from very technical timings to UX-oriented ones (as Speed Index)… And now your own metrics with Custom Timings. Of course, we encourage you to explore all these data from various perspectives that will undoubtedly be a source of new learnings!
Naturally, our export feature”inherits” this enrichment: all these new metrics are also included in the downloaded CSV files.
Advanced Timings in your groups of monitored pages
Groups of monitored pages also benefit from the new advanced timings. Therefore, you can now compare the evolution of 13 performance indicators for the monitored pages you have chosen to gather!
What about user journey monitoring?
This upgrade is not yet available for our user journey monitoring tool. However, do not hesitate to contact us now if you wish to be among the very firsts to be informed of this upcoming deployment!
It’s up to you now!
To conclude, the integration of Custom Timings – and advanced metrics – to Dareboost is a real scale-up for our web performance monitoring tool.
This upgrade now allows you to cross-analyze a wide range of standard performance data with customized metrics – for an even more relevant performance analysis of your web pages.
All you have to do now is to set up your own custom timings for the most significant elements of your pages, and Dareboost will immediately start to collect them!
Another article to go further on the topic: [Dogfooding] How Dareboost has benefited from Custom Timings monitoring

