At Dareboost, we have a motto: you can’t assess your overall website performance with one single metric! Nevertheless, some are more synthetical and relevant than others. We consider Speed Index as one of the most important indicators to analyze. Let’s discover why: what does the Speed Index indicate? How is it measured? How to interpret and use it properly?
How fast do your web pages seem to your visitors? That is the main question you’re trying to answer when measuring your web performance. However, that is definitely not the easiest thing to do properly!
None of the most known indicators (eg: fully loaded time) allow us to capture relevant and comprehensive information about user experience. New metrics, like Speed Index, have emerged to bring better results. Let’s have a look at the major characteristics that make this indicator a great way to assess user experience related to speed.
Speed Index is not (really) a milestone timing
That is one of the first things you have to know, that make the Speed Index quite a unique indicator in the webperf landscape: unlike most of the other metrics you could encounter, the Speed Index is not another milestone on the timeline of your web page’s loading. While it is usually expressed in milliseconds, the Speed Index is not a milestone timing but the result of a calculation. What is this calculation for? To transcribe the average rendering speed of a web page and its visual progress.
We will talk about this evaluation of visual progress later but keep that first notion in mind: Speed Index is more a measure of speed than a measure of time and provides a synthetical score on how fast the web page content is rendered. Speed Index is, therefore, a very practical metric that can be used to compare the experiences of different pages and track their performance as users perceive it.
Speed Index focuses on what a visitor sees
Here is another fundamental characteristic of Speed Index: it focuses on what a visitor sees. Not on what the web browser loads… That single feature actually makes the Speed Index a much more revealing indicator of the user experience than the fully loaded time for example.
As pages grow and load a lot of content that is not visible to the user or off the screen (below the fold) the time to reach the load event is extended even if the user-visible content has long-since rendered.
Patrick Meenan, “Introducing the Speed Index”
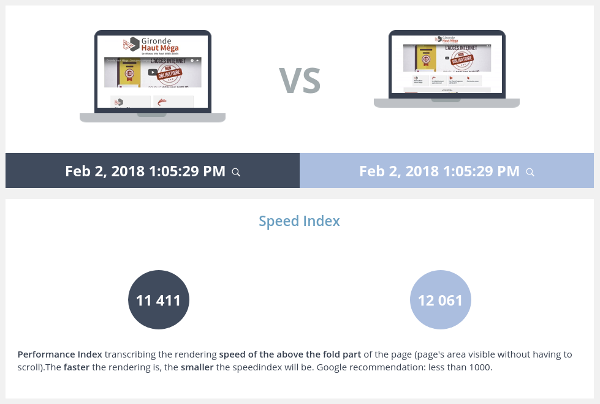
In practical terms, Speed Index only takes into account the above the fold parts of the page (directly visible by the user). As a consequence, this metric is highly dependant on the viewport size. As the comparison below suggests it (the same page tested with the same internet connection but different screen resolutions), you need to measure your page’s Speed Index with the viewport sizes that are the most currently used by your visitors.
Of course, Speed Index not only depends on the viewport size. Like all the other timings, it also relies on factors related to the user’s web connection for example (bandwidth, latency).
Measuring visual progress
The visual progress measurement, from which the calculation of the Speed Index is performed, is based on a video recording of the web page loading. This video is captured by the measuring tool you are using.
A couple of others metrics are based on video analysis. Let’s talk a little bit about them to better understand how Speed Index is computed and what additional information it provides:
- Start Render indicates the moment that the first element is visible on the user’s screen (the user’s viewport to be precise, as the video analysis only concerns the visible part of the analyzed web page). As a matter of fact, this interesting timing for UX marks the end of a full blank page for the user. Beware though: the first visible element to render is not necessarily a significant one (as it could be a background color or any minor visual information).
- Visually Complete indicates the time needed for the viewport area to be displayed under its final form. Here are a few more explanations coming from our user manual: “The final rendering state is captured at the end of our analysis, when Dareboost has detected the end of the traffic related to the page loading. By analyzing the video, Dareboost then identifies when this final rendering state has been completed”.
There we have two interesting milestones for user experience (how fast rendering starts and how quickly it is completed). Nevertheless, we still miss one essential information: what’s happening between these two timings? Let’s take an extreme example to figure it out: 2 web pages with exactly the same Start Render (500ms) et Visually Complete (2s).
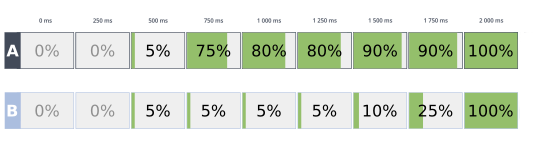
- Page A appears gradually. 75% of its content is displayed less than 300ms after the Start Render. Some details then appear at a slower pace,
- Page B remains almost blank for a long period and abruptly displays all its elements at 2 seconds.
No doubt about it: the user will find page A much faster to display than page B, while you – the tester – can’t detect any speed gap between the 2 pages from the Start Render and Visually Complete timers… That is exactly where Speed Index will be a great help!
How is the Speed Index computed?
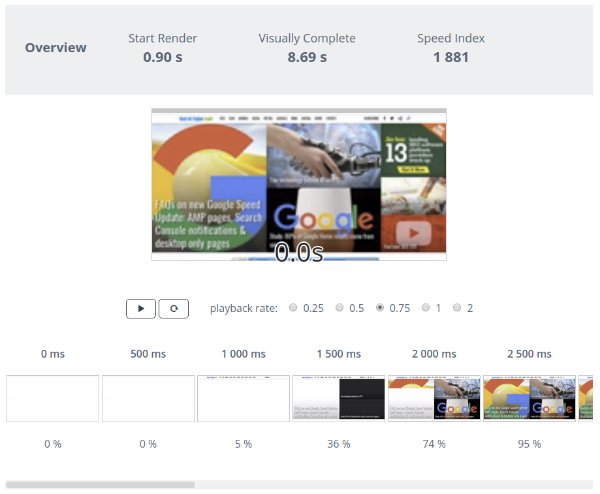
First, the video recording of the page loading is decomposed into frames. Each of these frames is inspected and assigned a percentage of rendering completion. To determine what is the progress ratio of a frame, the frame is compared to the final rendering state.
This results is a frame by frame evolution of the visual progress ratio for the tested web page. Each of the Dareboost test results includes a filmstrip of the page loading (see the illustration below).
Visual Progress through time can also be represented on a graph, with time being the X-axis and progress percentage as the Y-axis.
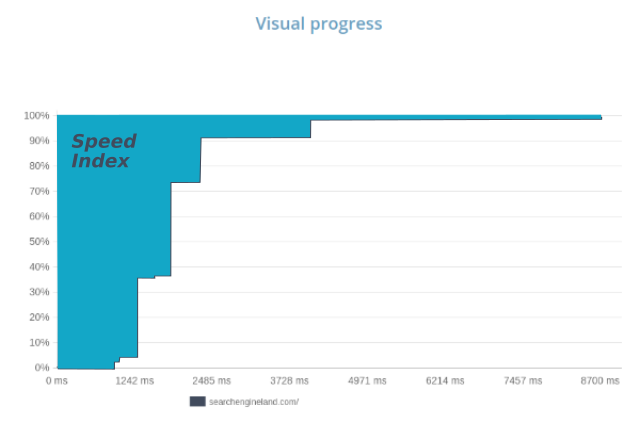
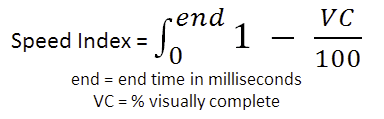
Speed index is actually the area above the line, which represents the blank area of the page over time. The smaller this area is, the faster the page is rendered. So the smaller is your Speed Index, the faster is your page!
This can be translated by the following formula (source: WebPageTest):
How to interpret Speed Index?
Now you know how Speed Index is calculated. Then you can guess how to interpret it: the lower the Speed Index, the faster the tested page is perceived. Let’s detail this shortcut to ensure you haven’t missed anything:
Low Speed Index → Small area above the graph of the visual progress → The unrendered part of the page over time is quickly minimized → Most of the page’s elements above the fold display with minimum delay → The page looks fast to render to the user
Then what about the value? What can be considered a “fast” Speed Index? Paul Irish, a Google Chrome Developer Advocate, recommends a Speed Index of less than 1000, a goal that might be hard to achieve for some kinds of pages and some browsing contexts. For example, you should expect a high Speed Index for the homepage of a news website, browsed with a poor web connection!
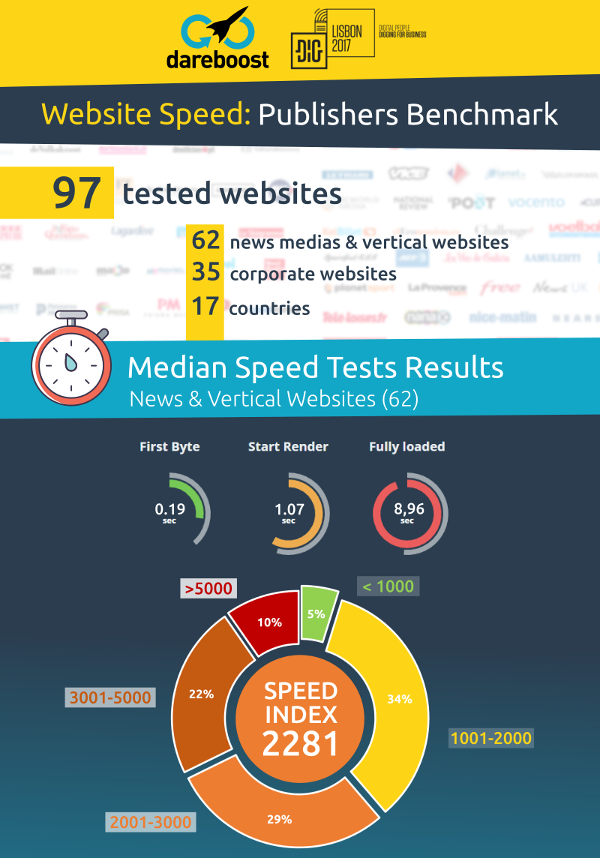
To give a few concrete examples, here are (above) the results of a Dareboost benchmark of 60+ leading European publishers. These Speed Index values have been measured according to the following context: a French visitor (located in Paris), browsing the web page via a desktop with an average web connection (8Mbps downstream bandwidth with a 50ms latency).
As a conclusion, one of the best ways to start interpreting your Speed Index may be via comparison and benchmarks against your competitors’ web pages: If you get significantly higher Speed Index then consider that your website may be penalized by its poorer user experience than your competitors…
Still, the Speed Index has some limitations
As we have learned how helpful Speed Index can be to evaluate how fast your web pages display on your users’ screens, now let’s talk a bit about its limits.
- First of all, keep in mind that Speed Index is sensitive to the viewport size. As a consequence, you should define a range of testing configurations that match your target audience.
- We’ve just seen that Speed Index computing is based on the final state of the page being displayed (the visual progress rate of each frame is compared to the final state). This may lead some issues in certain circumstances: some animations (as carousels, automated slideshows, videos) may tamper this final state detection, as the rendering may change several times while the page seems totally loaded to the user.
Fortunately, Dareboost has developed a couple of options to deactivate these animations and then stabilize your results in most of the cases.
To conclude with the limitations of Speed Index, let’s remind ourselves of the first sentence of this article: your overall web performance can’t be measured with one single metric. For instance, Speed Index does not give you any information about the user’s ability to interact with your interface. Depending on whether your content is highly textual or encourages interaction (forms, for example), the Speed Index will not have the same impact on user’s perception of speed. So keep in mind that even if Speed Index offers you exclusive benefits, you should use it combined with other indicators for a complete understanding of your web performance. And, of course, identify the best way to optimize it!
With thanks to Charles Vazac, Derek Johnson and Andy Davies for their proofreading.
Website Speed really a matter for any business, if you website loads with low speed then you will lose a lot of your business. Thanks for sharing those suggestions for page speed optimizations. It will encourage entrepreneurs to work more effectively on digital marketing and gain potential results from it. I would like to be here again to find another masterpiece article.
Good knowledge based article.
Do add what all should be done to improve on speed index.
Some of the points I am aware are :
1. Use of image tag to load images of appropriate size
2. lazy loading
3. Reduce JS payload or move them to footer.
4. Prefetch DNS
5. Define critical CSS and JS and make them inline.
6. Use of SVG VS Awesome fonts or small images
Hi Satish. Many Dareboost tips are dedicated to improving visual performance. Feel free to test your pages now.