Web agencies and their customers, managers and technical teams, are discussing and debating about load time without always understanding each others.
Whereas websites loading speed is an undeniable and strategic matter that every person involved within a web project should consider, relevant and consistent indicators for web performance have to be selected first. You can only improve what you measure and this measurement has to be reliable.

“Load time” just doesn’t exist!
That controversial titling highlights a reality: load time is an general concept, often used without designating one precise indicator! As a matter of facts, several tools talk about load time whereas their definition may greatly vary from one to another:
- The average Page Load Time provided by Google Analytics (available through Behavior > Site Speed menu) actually measures the time until the
onloadevent is fired. - Pingdom also coins a “load time” which is equivalent to the `onload` event firing. But, this indicator is used as a Fully Loaded Time within their waterfall, causing some rendering issues. To figure it out, we had to check the downloadable HAR file.
- Test My Site (Think with Google) in fact provides a Speed index measure. Something you can discover via a tooltip. As we’ll see later, using Speed Index is a good thing. But naming it “load time” is misleading. At last, this tool gives very few information about the testing context (which location? What kind of 3G connection?).
One more example with Alexa’s tool, giving the current definition:
The load time of an individual page is how long it takes for the DOM – the structure of the page – to be loaded. This time doesn’t include the time to load all images and stylesheets, for example.
Alexa.com
By excluding the images (more than 50% of the total weight of the web pages nowadays according to HTTP Archive) and also stylesheets (whose loading is blocking the visual rendering), Alexa is very far from measuring user’s experience!
Even if we should question the value of such an indicator, we have to acknowledge the transparency of the tool, giving a definition for the provided indicator.
Nevertheless, as a lot of tools do, Alexa fails while giving no information about measuring context: with a robot or a real browser? What kind of connection? From which location? All of these parameters are critical ones though, as they strongly impact the measured values. Without any of these information, we can’t rely on them as they may lack of constancy over time!
You’d rather use tools that clearly mention their testing methodology (which metrics are gathered and how they are measured). Doing so, you will avoid bias, misinterpretations and groundless debates.
Time until the end of loading
You will also find a load time indicator on Dareboost. Yes, you read it! Still, we are not
schizophrenic. Indeed, we measure the Fully Loaded time (one indicator you may find on some other tools).
A few words about our measuring methodology: Dareboost requests the web page and then listens to the network activity. Our web browser (Chrome) waits for a significant interruption of the network traffic before considering the web page to be fully loaded. Do not hesitate to browse our documentation for more details:
Web Performance Testing > Load time / Fully loaded
Fully Loaded Time and User Experience
Can we consider, though, the fully loaded time as a relevant indicator to evaluate user experience related to a webpage’s performance? One single example will be enough to blow this hypothesis away… So let’s compare the web performances of 2 very well-known SEO news websites: Searchenginejournal.com and Searchengineland.com. Have a look at the video replay of their homepage loading…
Which one seems the fastest to you?
No dramatical gape between these 2 browsing experiences, but you may find Searchengineland.com a bit faster, as its rendering starts sooner and the main images display too.
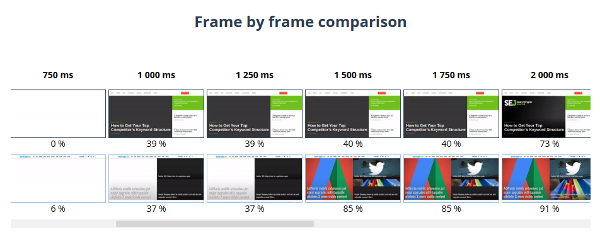
For a more detailed analysis, you can also take a look at the filmstrip within the comparison report provided by our testing tool:

This confirms the narrow victory (in matter of speed) of searchengineland.com: indeed, at 1,5s, it gets 85% completed while Searchenginjournal.com only reaches 40%.
For the most curious of you, let me point out that the current test has been operated via Dareboost.com, simulating a Seattle-based user of Google Chrome desktop browser and a Cable connection with a 10Mbps downstream bandwidth (28ms latency).
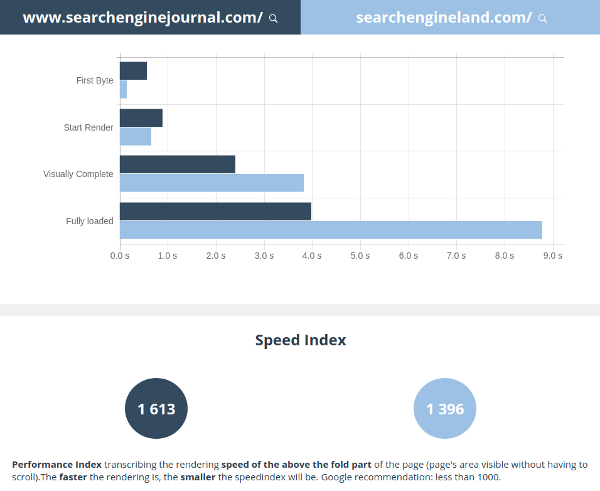
Let’s get back to fully loaded time values from the very-same test and check what they tell us … The results are quite different! 3,95 seconds for Searchenginejournal.com against 8,75 seconds for Searchengineland.com!
So, according to the fully loaded time analysis, we would conclude that Searchengineland.com is more than twice slower than Searchenginejournal.com. That is an inconsistent conclusion regarding the video replay analysis !
Then why did Search Engine Land get such a higher fully loaded time compared to its competitor? Because this indicator takes into account all of the HTTP requests and responses that are triggered all along the web page’s loading, including the deferred ones and even those that don’t impact the page rendering nor interactivity (for example: retargeting technologies).
In other words, the fully loaded time absolutely does not transcribe rendering speed for users but is no more than a technical loading delay.
Days after days, web pages get more and more complex, no longer limited to few lines of HTML code… Always enriched with more media, more features and external resources, and also a growth of asynchronous behaviours or progressive techniques to get a smoother browsing experience.
Nowadays, the fully loaded time has completely lost its relevancy about website speed as perceived by the end-user. And its only remaining interest is purely technical.
Speed Index, an indicator about UX!
If we no longer can rely on the time until the end of loading to evaluate our web pages speed, what other metric to trust then? For a few years now, a new range of indicators has emerged, based on video analysis. A testing base that is directly focused on the user experience related to the web page rendering!
Dareboost, among others, provides 3 major indicators based on this kind of analysis:
Those 3 indicators are all focused on the above-the-fold part of the page (visible without having to scroll)! Start Render, Visually Complete and Speed Index are complementary, but if you’d have to choose a single one, you should go for the Speed Index. It synthesizes the whole complexity and progressiveness of the web page rendering, as perceived by a visitor, in one single value.
Even if the Speed Index is computed from a smart mathematical formula (read this article for further information about our 3 indicators based on video analysis), it is quite easy to use: the lower it is, the fastest your web page displays.
So let’s check that with our previous comparison between Search Engine Land and Search Engine Journal:

1396 for Searchengineland.com; 1613 for Searchenginejournal.com… With the Speed Index , we do catch up the speed gap that we’ve observed empirically by watching the page’s loading video !
Nevertheless, the “load time” issues and limitations described through this post have to teach us one important thing: performance of a website can hardly be measured with a single indicator! If Speed Index can be considered today as the most “synthetic”, it may not be relevant in all cases!
As an example, Speed Index may be tampered by animations. This could affect the indicator’s consistency or make it irrelevant to transcribe the rendering speed.
Once again though, as a complete tool to manage your web performance in all cases, Dareboost allows to handle those kind of issues! Our advanced testing parameters offer a special feature to deactivate the animations of your web pages. A feature (still experimental) that will allow to deal with most of the cases by disabling CSS3 animations or Carrousels for example.
Conclusion
To successfully manage your website performance, you first have to adopt a reliable and rigorous measuring tool – as Dareboost of course! Then, identify and use a combination of several performance indicators, meeting your objectives. If you would have to keep a single one, It should be the Speed Index!
A few other metrics are emerging and are very promising, even if some would still need to gain in robustness. For example, First Meaningful Paint could become an excellent complement to Start Render, allowing to only consider the rendering of content with a significant interest…
