You may already have dreamed of it: being able to measure exactly when one image of your web page is rendered or a particular script is executed, and track this moment through your favorite tools. The User Timing API made it possible, allowing you to place marks wherever you need within your pages! That feature is now supported by all the most recent browsers. And Dareboost is about to let you benefit from it at a larger scale!
What are Custom Timings for?
Remember: load time is out! Through this somewhat provocative title we have previously explained on this blog that web performance is a so complex matter that it is impossible to rely on a single indicator to evaluate the user experience of your web pages’ loading.
Web browsers offer more and more tools dealing with web performance. In 2015, for instance, we have presented the Performance Timings API and the various indicators you can collect through it. Nevertheless their scope remains mostly technical.
If you are a Dareboost regular user, you already know that a Synthetic Monitoring solution allows you to largely supplement your measurements with other indicators. For example with those based on video analysis to get as close as possible to the user experience. Speed Index case may be one of the best example, as explained on our dedicated post.
However, all these indicators still let you confined to a generic approach to web performance measurement, while you intend to speed up your website in order to improve your own business, optimize your own conversion rate. You should therefore focus on measuring the performance of the components of your own website that are critical to your business, i.e. setting up your own web performance indicators.
This is exactly what Custom Timings offer: they will allow you to easily gather the most meaningful measures according your own activity and visitors, and thus free you from the limitations of indicators too generic for your needs.
How to use Custom Timings (User Timing API)?
Gather a mark with performance.mark()
The User Timing API is quite easy to use. Thanks to it, you can ask the browser to “mark” one particular time – and give this mark a name – whenever you want during the page loading. Afterwards, you can gather all these marks to use them.
Here is how you can trigger such a measure:
performance.mark("my-custom-timing");Interpreting that JavaScript command, the web browser will populate a list you can access via performance.getEntries().
The collected timing measures the number of milliseconds (high precision) elapsed from the beginning of the page load (navigationStart). The entry is added to the PerformanceEntry list with a “my-custom-timing” name and a “mark” entryType. You can use this type to discriminate between User Timings and other API indicators, which are stored in the same collection.
Indeed, please note that one mark name actually hosts a list, as you can make several calls of performance.mark() by using the same name.
NB: In its specification, W3C recommends to use the following naming convention to mark the most common interactions:
- “mark_fully_loaded”
- “mark_fully_visible”
- “mark_above_the_fold”
- “mark_time_to_user_action”
Utility methods (measure, clearMarks and clearMeasures)
performance.measure()
Sometimes you may be more interested in measuring the delay between 2 particular marks than the time elapsed from the beginning of the webpage loading, as performance.mark() does it.
In this case, you can use a measure, allowing you to get the difference between 2 marks:
performance.measure("difference", "start", "end");The first argument defines the name of the created measure, followed by the starting and ending marks names. You’ll get a new entry in your list, with a “measure” entryType.
We haven’t mentioned yet that these Performance Entries also come with a “duration” attribute. As marks duration always get a 0 value (a mark has no duration), measures duration corresponds to the difference between the ending and the starting marks.
Let’s go back to our initial example:
performance.mark("start") // 100ms
/* some executions here */
performance.mark("end") // 500ms
performance.measure("difference", "start", "end");
Then we get a measure called “difference” with a value of 100ms for startTime and a value of 400ms for the duration.
performance.clearMarks()
Measures and marks are deleted each time a new page is loaded. But, sometimes you may need to clean them before that. While using a Single Page Application, for example. In this case, the browser won’t load any new page. So if you need to get back to a blank state before each new browsing step of your users, you may appreciate clearMarks().
Note that this function can also take as argument the name of a given mark you wish to delete the values list.
performance.clearMeasures()
Logically, clearMeasures() offers the same behavior for the entries with a “measure” entryType than clearMarks() for the marks.
Gather the results
You can retrieve the results in 3 different ways, whatever the entries are (marks, measures and even other standard types populating the list):
- performance.getEntries()
- performance.getEntriesByName(name, entryType)
- performance.getEntriesByType(entryType)
The first function allows to get all the available entries whatever their type. With the 2 other functions, you can filter the entries by type (resource, paint, mark, measure, frame, navigation) and event directly by name.
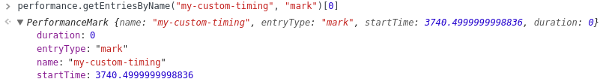
As an example, if you want to retrieve one particular metric in your browser console, you can type in:
performance.getEntriesByName("my-custom-timing", "mark")[0].startTimeA well supported feature but beware of biases
To conclude this chapter about the User Timing API, note that you can use it as widely as you need it since it is supported by all the most recent browsers: https://caniuse.com/#feat=user-timing
One single warning though: beware of the conclusions you may draw from the measures gathered through Real User Monitoring, if your website traffic includes older web browsers. As a matter of fact, browsers as IE9 or Safari 10.1 don’t support this API. Then you won’t collect Custom timings from this poorly tooled part of your audience. This could give you a more optimistic overview than reality!
A few examples to inspire you
If you still don’t imagine how helpful the Custom Timings could be for your web projects or in which case you could use them, here are a couple of inspiring examples:
- Discover how long a blocking script takes to load and to be executed;
- Gauge how long you web page hero image takes to display;
- Measure the execution time for a process triggered by a user action;
- Evaluate the precise moment of the initialization of a SPA.
Useful tools to exploit Custom Timings
Displaying the results in your browser console – as mentioned above – may be useful. But it is far from the best solution to include the Custom Timings in your web performance management workflow.
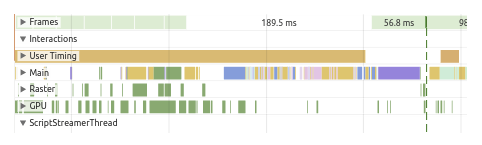
With Chrome Dev Tools, via the Performance tab, you can retrieve the measures presented on a User timing line:
Real user Monitoring tools are also suited to handle those data. For example, here is a script to make the integration easier with Google Analytics (among others tools): https://gist.github.com/pmeenan/5902672#file-user-timing-rum-js
You can also benefit from these custom indicators and from all the advantages of Synthetic Monitoring at the same time (full range of collected data, measurement stability, available on preprod environments, etc.). Doing so, you will be able to complement indicators based on video analysis like the Speed Index, with metrics related to the loading (or the rendering) of critical elements for your own activity. Use cases are unlimited and your use of the User Timing API will evolve over time.
And we are very glad to conclude this post with this announcement: Dareboost will soon support now supports the User Timing API across its different features (web performance reports, monitoring data, etc.)!