This is the second part of our weekly series about Google toolkit for web performance. A few weeks before the Speed Update (Google algorithm change expected on July 2018) this collection will help you to benefit from the best of the available tools and to avoid tricky mistakes. The tool of the day is perhaps one of the most well-known: Google PageSpeed Insights.
PageSpeed Insights: a recent upgrade to prepare the Speed Update?
Before discovering in details what you can achieve with PageSpeed Insights (PSI), let’s focus on the recent history. On January 10, 2018, an announcement on the Webmaster Central Blog described the last upgrade of PageSpeed Insights.
[…] we’re announcing that PageSpeed Insights will use data from the Chrome User Experience Report to make better recommendations for developers […]
We will let you know more about this change later in the post. What we want to highlight here is the fact that the PSI upgrade has been announced only 1 week before the Google Speed Update (January 17, 2018). Yup. Google has upgraded one of its major service dedicated to performance only 7 days before announcing they will use page speed in mobile search ranking. Intriguing, isn’t it?
Actually, the Speed Update announcement directly suggests that the tool (and the embedded Chrome UX Report data) is a useful resource.
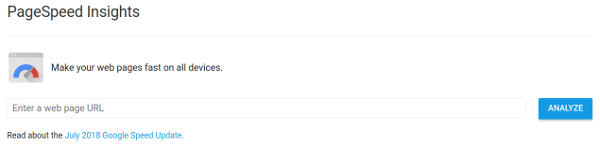
Discovering the homepage of PageSpeed Insights will just confirm its interest in the context of the Speed Update as the announcement is actually mentioned just after the analysis form of the service. The circle is complete.
Let’s dig in what the tool has to offer!
PageSpeed Insights is not a Speed Test Tool
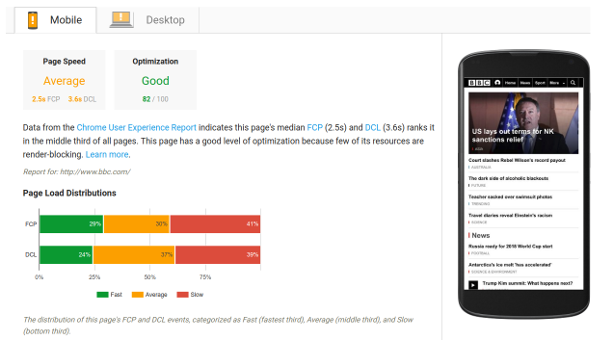
The tool may mislead users who would focus on the results without reading the textual explanations. Actually, clicking the “Analyze” button won’t run any speed test, contrary to Google Test My Site. The Performance data available in the first part of the report are extracted from Chrome UX Report, a huge database of anonymous data collected from Chrome users all over the world during their navigation sessions.
Some people are surprised to see a “Unavailable” message instead of the performance metrics in their reports. As previously explained, PSI does not conduct a speed test but displays real traffic performance data (Real User Monitoring) collected by Chrome. Thus, metrics not being available has a simple explanation: the analyzed page has not enough traffic (collected metrics would not be statistically relevant).
NB: the tool is providing the results for a given page. If you’re facing the “Unavailable” message, or simply wish to access the results for a whole website, a dedicated command is available. You can prefix the URL in the analysis form by “origin: ” (for instance: “origin:https://www.dareboost.com”).
In Chrome UX Report the performance metrics are segmented by 3 params: country, device type (desktop, tablet or mobile) and internet connection (“slow-2g”, “2g”, “3g”, “4g”, or “offline”). You have to keep in mind that Real User Monitoring have to be exploited very carefully as some data may be collected from traffic not being part of your targeted audience. It’s great to have those data directly available in PageSpeed Insights. Still, they are only segmented between Mobile and Desktop (tablet data is not displayed). All connection types and countries are mixed-up in the provided results.
That being said, we had another concern: data freshness. We were expecting a significant delay between data being gathered in Chrome UX Report and those exposed in PSI. We were wrong and have to admit that Google has done a great job here. Comparing PSI with its datasource, we have been able to understand that available metrics are really close to those from the last month. As we investigated, we discovered – and this was confirmed by Rick Viscomi – that the data available in PSI is updated daily.
The CrUX BigQuery dataset is updated monthly while PageSpeed Insights is updated daily. So if you more recently started getting lots of traffic it’d make sense that you’re only seeing data in PSI. You’ll probably be in the next BQ release.
— Rick Viscomi (@rick_viscomi) 27 juillet 2018
As data are collected via Chrome, unlike traditional Real User Monitoring services, it requires no installation and is available for any website. Even your competitors’! That’s the real value of the tool.
Dom Content Loaded and First ContentFul Paint
In our previous article, we’ve seen that Google Test My Site is providing a Speed Index. The KPIs provided by Google with PSI are Dom Content Loaded and First ContentFul Paint. Are they relevant performance metrics? Answering this question is always depending on what you want to achieve.
Dom Content Loaded (DCL)
The Dom Content Loaded is defined in the Google PageSpeed Insights FAQ:
DOM Content Loaded (DCL) measures when HTML document has been loaded and parsed
If that does not really ring a bell for you, that’s ok. It’s a technical KPI that can’t be related directly to something happening on the page loading for a visitor. After this delay, you have the guarantee that the synchronous scripts – and those with a defer attribute – have been executed. The same applies to stylesheets loaded synchronously. Dom Content Loaded event is widely used to trigger asynchronous treatments (many javascript frameworks rely on this event).
First ContentFul Paint (FCP)
The First ContentFul Paint is also defined in the Google PageSpeed Insights FAQ:
First Contentful Paint (FCP) measures when a user sees a visual response from the page
Unfortunately, that’s not totally true. This is rather the definition of the Start Render metric. Start Render is computed from a video analysis of the page loading. And that’s not something Google Chrome can do. First ContentFul Paint exact definition is a bit more complex:
[..] the time when the browser first rendered any text, image (including background images), non-white canvas or SVG. This excludes any content of iframes, but includes text with pending webfonts.
This may not be easy to understand here, but First ContentFul Paint can occur before the user can see anything on the screen. For instance when a text is requiring a custom font to be loaded before being rendered. It may result in an additional complexity to understand and use the FCP metric.
However, contrary to the Start Render, FCP won’t be triggered by a background color or any other kind of CSS decoration being displayed before some content (hence the “Contentful” of First Contentful Paint).
PageSpeed Insights to check your pages against performance best practices
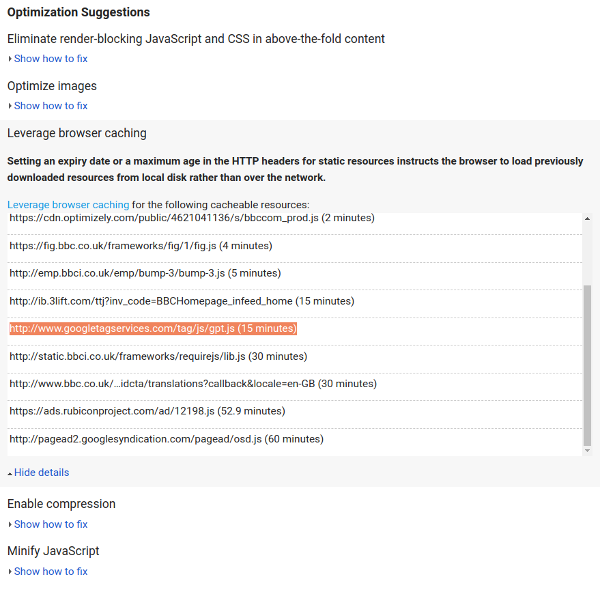
The last part of the PSI report is dedicated to the performance best practices. A dozen of of controls are applied to the analyzed page. PSI will list the results as optimization recommendations, and you’ll also know which best practices the page already complies with.
This is a useful source of information. Still, that’s not enough if you’re serious about optimizing your website for speed. You may want to give a try to Dareboost. We will get you covered with the same best practices than PSI, but also a dozen more about performance. And we will also check a lot of other best practices regarding security or SEO for instance!
Dareboost is also available for free: you can test up to 5 pages per month by creating an account (you don’t even need one to get your first analysis report). Another regret about PageSpeed Insights is related to the insights themselves: they are neither detailed nor customized according to your context.
To conclude, PSI is a great resource. You can access Real User Monitoring data for free – for your pages as well as for your competitors’. Be aware that provided metrics (FCP and DCL) are not telling much about the user experience related to web performance. The provided optimization recommendations are a good starting point, but using a professional tool like Dareboost will for sure help you to save some time and to focus on what really matters.
Regarding the Speed Update, no doubt that PSI and related communication offer valuable clues about what would be Speed signals for Google. But let’s wait for our next article to discover yet another tool before jumping to any conclusion.
Continue your reading with the next part of our collection: Lighthouse: a powerful tool included in Chrome and DevTools.
Nice article thanks for the share, Page speed has been a important factor for long time they just changed it how they gauge their speed. it is now very important to optimize both desktop and mobile page for better user experience
Really nice blog!! Page speed is an important element for every website to optimize on all devices. Google Page Speed Insights is also a useful tool to increase website page speed.