This is the first part of a serie of articles we’re dedicating to Google tools related to website speed test and analysis.
Today’s tool: TestMyWebsite. Powerful service or simple gadget?
Speed Update and Google tools for Web Performance
Google Speed Update will be released in a few weeks (July 2018). What are the signals used by Google to gauge the speed of a page? For the time being, we just have no tangible information. We just know that Google encourages developers “to think broadly about how performance affects a user’s experience of their page and to consider a variety of user experience metrics“.
Google tooling ecosystem related to website speed measurement is wide and offers a variety of data, from TestMySite to Lighthouse through Page Speed Insights (PSI). The number of website owners and developers increasing their use of those services might be significant since the Speed Update announcement. Thinking that available data may be part of the Speed Update signals for the search engine makes sense.
As a company dedicated to web performance, we wanted to share our analysis through a serie of 5 articles to discover Google Tools for speed measurement. To know how to use them and to be aware of their limitations. And finally to question ourselves about which data could be the best candidates as part of a speed signal (for the Google Speed Update or a further algorithm change).
This first blog post is dedicated to Google Test My Website.
Google TestMySite, an easy-to-use service
The TestMySite.withgoogle.com tool is the first result for the “test my website” search request. Thus we can assume the service is far from suffering a lack of visibility.
Once on the site, no doubt about the next step, you just have to type the URL to be tested:
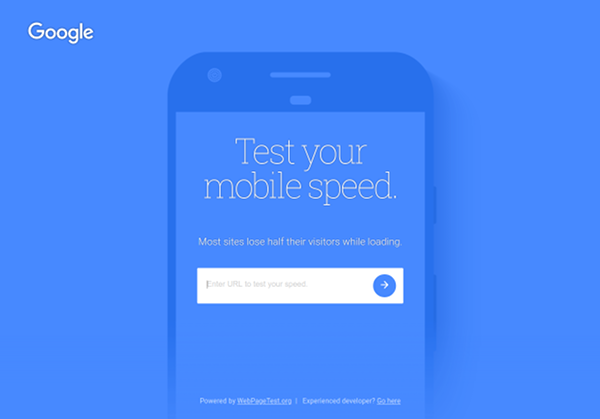
The most attentive readers may have spotted (in the page footer) a mention of WebPageTest. TestMySite is actually built on top of this Open Source project (a very well-known tool in the web performance world).
When submitting the form, you just have to wait (from a dozen seconds up to a minute) for the test to be completed.
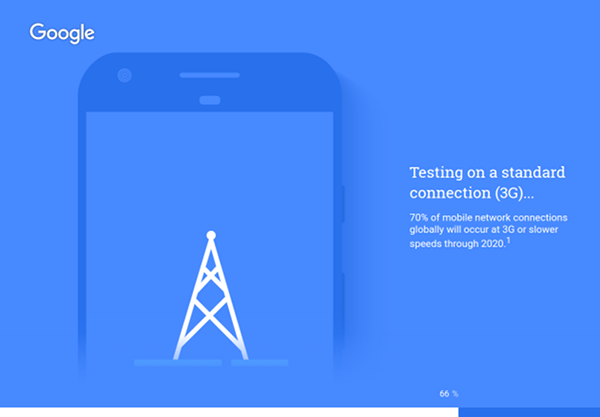
The loading page – with a neat design – will give you some interesting tips about how the tool works. For instance, you may note that the website speed test is conducted with a “standard” 3G connection.
Here’s a preview of the resulting report:
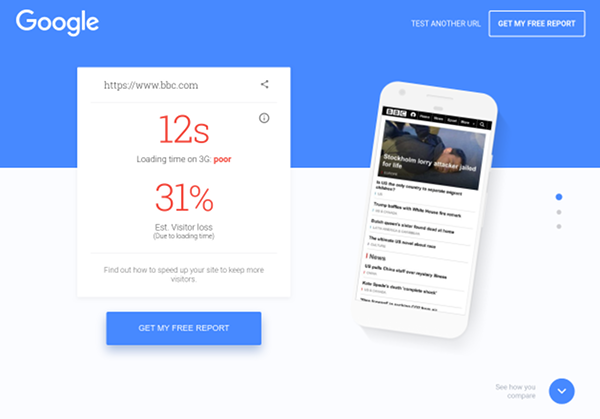
The report layout is also neat and very easy to understand. The first part delivers 3 main pieces of information:
- An insight about how good are the results, “Poor” in the previous screen (the info is also reinforced by an intuitive green/orange/red color code).
- An estimate of the number of visitor loss due to loading time (be cautious, that is just a probability. This projection is based on a study conducted exclusively on Google Adwords landing pages).
- The measured loading time.
Let’s stop a minute. Google is talking about loading time? If you have not read yet our article “Load time is out!”, you won’t have a better chance.
Actually, this so-called “loading time” is actually a Speed Index. It has nothing to do with a fully loaded time, for instance. Except for the misleading name used by the tool, the Speed Index is a great metric, very appreciated in the web performance field.
Reading the related tooltip will not only confirm that the tool is measuring a Speed Index but also give us some information about the context of the speed test.
Loading time:
This is Speed Index, how long the visible content of your page takes to appear using Chrome on a Moto G4 device within a 3G network. Loading time can vary based on server location, device, browser, and third-party apps. If your site contains carousels, overlays, or interstitials, this may impact your loading time results. To perform a website speed test using different settings, visit webpagetest.org.
As stated, the context of the speed test is impactful on the Speed Index result. However, we don’t have enough details at all about this context. What is exactly the connection behind this “standard” 3G? Is the Emulated Motorola G also taking into account the proper viewport and device pixel ratio? From which region the test has been conducted?
We have moved forward our investigation. By inspecting HTTP responses during the tool usage, we have been able to recognize the WebPageTest API signatures.
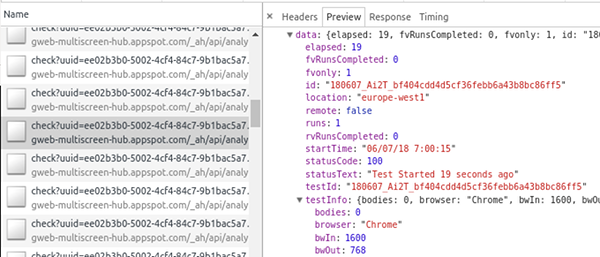
We now have a little more data about the context, even if we still have no guarantee for it to be identical from one analysis to another.
- Downstream bandwidth : 1.6 Mbps
- Upstream bandwidth : 768 kbps
- Latency : 300ms
- Location : europe-west1 (which would be Belgium if we’re relying on Google Cloud regions)
Be careful, as we know for sure that at least one parameter of the context may vary: the test location. Using the service from the United States (rather than from France, where our office is located) we have noticed that another region was used: us-central1. Test My Site seems to detect the user location from its IP address in order to choose the test location accordingly.
Unfortunately, if your IP address is not properly detected, or if the country you’re in is not the same as your target audience, you just don’t have an easy way to know the context is not relevant… neither you can adapt the configuration, by the way. Still, we have to recognize that the tool is warning us about it through the tooltip.
The lack of contextual knowledge should also be kept in mind when reading the rest of the generated report:
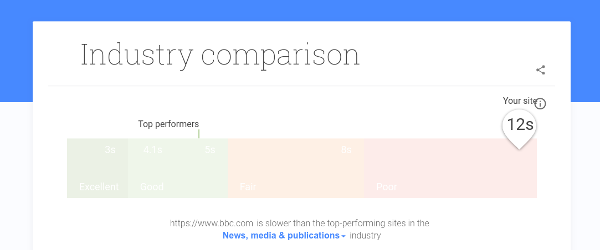
This industry comparison is potentially very interesting. Still, how can we ensure that the approach is reliable? Even assuming that the site has been properly tested in a relevant context, we can hardly rely on these industry-specific data without having the certainty that the very same context have been used to collect them? And are they, again, exclusively Landing Ads pages? How does it compare with the page you are testing?
Let us move on to the last part of the report. There we find an estimate of the potential of optimization of the loading speed of the page. Please take that information with a pinch of salt:
Estimated time savings assumption is from the PageSpeed Insights “Bytes saved” figure and an internal Google study correlating reduction in page weight with the resulting impact on load time. Loading time savings vary depending on network, device, server, site design, and implementation.
The service then offers some optimization tips that are part of the well-known web performance best practices.
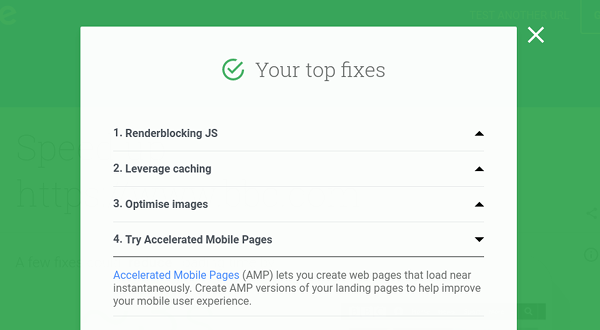
Not much to say about this, the recommendations come from Page Speed Insights which will be reviewed in a future article.
One cannot help but notice the promotion of AMP that has been displayed for the occasion.
If the tool does not detect any possible improvement, you will rather be offered to promote your mobile page on Adwords…
If you agree to be contacted again for commercial requests, the service offers to email you a detailed version. Ignore the invitation: the email only contains a few additional recommendations, always from Page Speed Insights, so you might as well get to the source.
To summarize: despite its flaws, the service fulfills its promise as an evangelization tool focused on web performance, intended for a neophyte audience. Nevertheless, we’ll regret the lack of nuance and context leading to big announcements on approximative gains that could result in bad decisions.
If you are looking for a more reliable test, consider using WebPageTest which is more powerful, in spite of its complexity. And if you are looking for an efficient GUI, tailored to both decision makers and developers, while benefiting from ready-to-use monitoring and reporting features, Dareboost will be your best option!
Continue your reading with the next part of our collection: PageSpeed Insights: the best tool to check your website performance for the Speed Update?
For our client showcase, TestMySite is a super easy way to explain the terms, because they can see what the experts say.
Besides key features like Load Time, TTFB and others, what are the major metrics you’re monitoring and why?
thnx