One year after the Speed Update has been released, Google has launched a brand new Speed Report within the Search Console. The Speed Report is using the Chrome UX Report data to highlight the slow pages of your website. Let’s discover how to use the Search Console Speed Report and how to interpret the related performance metrics (FID and FCP). As a conclusion, we’ll focus on speed as a ranking signal and the further changes we might expect within the Speed Report.
Search Console Speed Report, a direct access to Chrome UX Report (CrUX) data for your domain
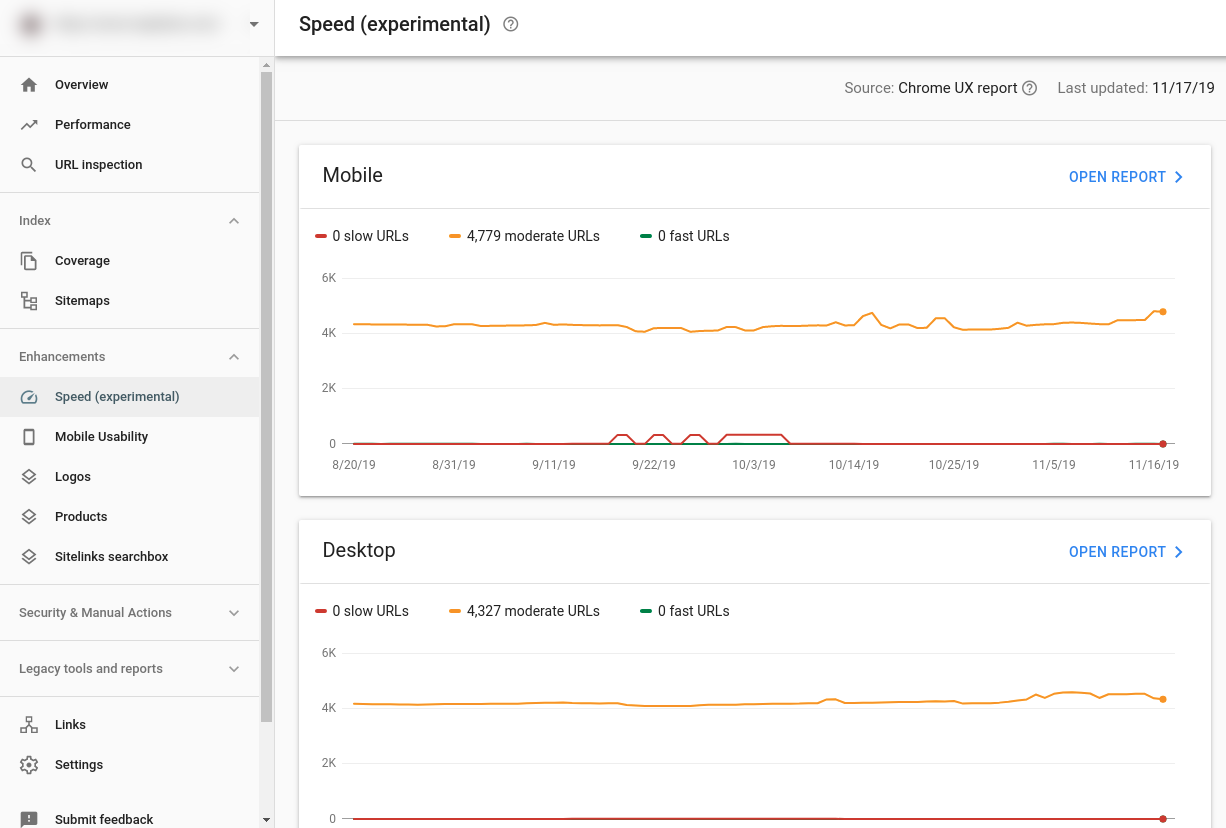
Accessing your Google Search console, you may have noticed a new item in the menu, the Speed report (within the “Enhancements” sub-menu):

From the homescreen of the Speed report, you’ll have a quick overview of the evolution of your site speed, segmented by device type (Mobile vs Desktop). To be more specific, the charts are showing the number of pages Google is considering slow, with a “moderate” speed, or fast through time.
You may be surprised by a significantly lower number of URLs here than on your Coverage report. It makes sense, we’ll get back to it shortly.
The tool is advertising the data source of the Speed Report: the Chrome UX Report. We have already written about the Chrome UX Report (CrUX) on our blog, as it was already used by Google PageSpeed Insights.
Chrome UX Report (CrUX) is forged from data collected via Chrome, directly from its users browsing the web. So the data from the Speed Report are the performance data from your very own traffic, at least a part of your traffic using Chrome as a web browser.
Unfortunately, that means you need enough Chrome traffic on your web pages to ensure that you have data available in your Speed Report. That may explain the previously mentioned difference in URLs count between the Speed report and the reality of your website.
For small websites, not having enough data in Chrome UX Report for any page, all you will get is a warning message:

Hopefully, you’ll have enough traffic to get some data and you’ll then be able to access a detailed report for both Mobile and Desktop segments.

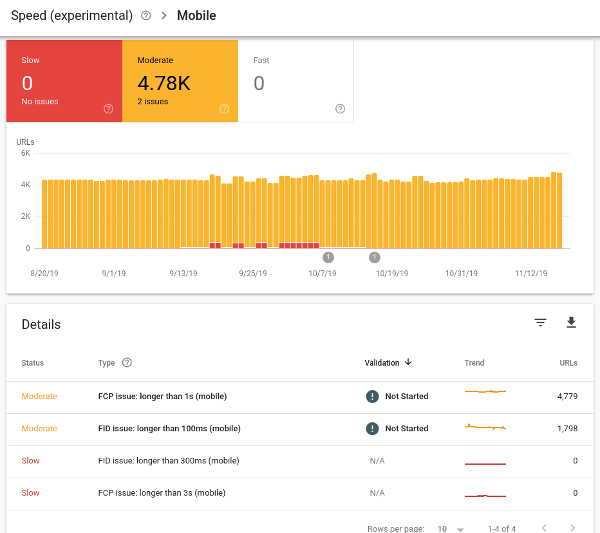
Once you have selected the report for a given device type, you can note that Google is considering both “Slow” and “Moderate” pages as being an issue. The report is very similar to what you’re already used to with the Mobile Usability report for example.
The tool is giving you the number of URLs that are related to a same issuer (that are not considered fast enough by Google).
When clicking an issue, you’ll be provided with a list of URLs. Each URL is a sample of a group of URLs sharing speed status, metric type, and similar URL type (performance issues in similar pages is probably due to the same underlying problem as stated per the documentation. Still, the grouping mechanism based on URL patterns may not be a good fit depending on your website).
You can access a sample of 20 URLs for a group, but the full list is not available.
Google is focusing on 2 performance metrics to gauge the speed of the page.
First Contentful Paint (FCP) and First Input Delay (FID)
You might already be familiar with these metrics, as Google is already highlighting them in PageSpeed Insights.
In a few words:
- First Contentful Paint is the delay before the page starts to render some content (text or image). We have dedicated a previous post to FCP if you want to know more.
- First Input Delay is the delay required for the browser to respond a the first user interaction (clicks, taps, or key presses) on the page. When your website is using Javascript, it may result in a janky experience for the user, due to the browser not being able to promptly respond to a user interaction. That’s what the First Input Delay is measuring, for the first click of the user.
For each group of pages, the Aggregate value of the metric is provided.
- Aggregate FCP is the time it takes for 75% of the visits to a URL in this group to reach FCP.
- Aggregate FID is the time it takes for 95% of the visits to a URL in this group to respond to the first user interaction on that page.
More precisely, it’s the 75th (or 95th) percentile of the metric:
- if you have an Aggregate FCP of 1.2 seconds, it means 75% of your visitors experience a FCP faster than 1.2 seconds for the related pages (75th percentile).
- if you have an Aggregate FID of 150 milliseconds, it means 95% of your visitors experience FID faster than 150 milliseconds for the related pages.
To allocate a status to a page, Google is using the following thresholds:
| Fast | Moderate | Slow | |
|---|---|---|---|
| FCP | <1s | <3s | >=3s |
| FID | <100ms | <300ms | >=300ms |
(from the Speed Report Documentation)
Note that targets are the same for both Mobile and Desktop devices!
If a page has two different status for the two metrics, the most defavorable status takes precedence. An an example, a page with a “Fast” FCP but a “Slow” FID will be considered “Slow”.
Resulting status of the page according to its FCP et FID statuses:
| FID \ FCP | Fast | Moderate | Slow |
|---|---|---|---|
| Fast | Fast | Moderate | Slow |
| Moderate | Moderate | Moderate | Slow |
| Slow | Slow | Slow | Slow |
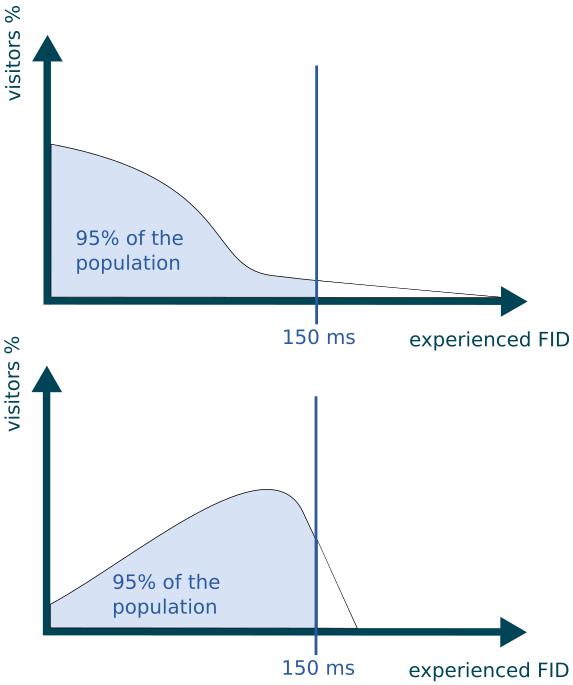
Please note that you don’t have any information about the distribution of the user experience from an Aggregate metric.
Let’s take again the example of an Aggregate FID of 150 milliseconds (95th percentile). The 2 following distribution charts are compatible with this same Aggregate FID value:

To conclude on the subject of aggregated values, please keep in mind that:
- 95% of fast sessions are required for FID to get the Fast status, but only 75% for FCP
- this selection is totally hiding the results for your visitors with the worst experience (the 5 slowest % for FID, and the 25 slowest % for FCP).
- the aggregate says nothing about how the performance results are distributed in the given percentile. You can have a 75th percentile of 10 seconds and 74.9% under 1 second (in theory, the example is a bit extreme!).
Another limitation to be noted when reading those data: it’s collected from your website’s traffic (Chrome only), and your visitors are not equals. You only have 2 segments available, Desktop and Mobile, whereas your visitors are using hundred of devices, different connection types, some have already visited your pages and some are not, their browsing contexts are different (some would experience ads and retargeting, others may block them),etc. Still, all of their performance data are mixed together in the Speed Report.
Thus, some pages that are technically identical can show very different results from the Speed Report perspective, just because they have a different audience (for example, your top blog post having a wide international traffic compared to your other pages. As this audience may include countries with slower infrastructure or devices, the page will probably be shown as slower, meaning the overall experience for this page is slower, even if the page itself is not slower than others).
If you’re familiar with Web Performance, keep in mind that Speed Report has the exact same limitation that the ones you can face using a Real Using Monitoring tools.
Frequently Asked Questions about Speed Report
Why my website doesn’t have Fast pages?
Some could be disappointed by getting Fast results for a page on PageSpeed Insights but having the same Page being tagged as Slow or Moderated in the Speed Report.
Remember that, for page page to be Fast in the Speed Report, you should have 75% of experienced FCP unders 1 second AND 95% of FID under 100 milliseconds.
You have to meet both conditions, whatever the typology of your traffic is.
As you can see from this PageSpeed Insights report, testing https://www.google.com shows they do not meet the criteria either, even if the bars are mostly green:

How can I check the status of a specific URL?
You can’t, except being lucky and the URL being used as a sample for a group. As per the documentation of the tool: “The report is not designed find the status of a specific URL”. However, you can use PageSpeed Insights to do so.
How can I know if I’m fast enough for my market?
Check your competition.
Speed Report is using data from CrUX to give you insights about your slow web pages.
You can access your competition data as well by using PageSpeed Insight (or BigQuery if you’re not afraid to compose your queries https://web.dev/chrome-ux-report-bigquery/).
Dareboost is offering a dedicated tool to compare your website with your competitors.
I’ve optimized my website, why is the Speed Report not showing the improvements?
The new Search console is generally providing very fresh data. It’s a bit different for the Speed Report, as the performance data as extracted from a one-month rolling period of time (not totally confirmed).
Monitoring your website performance to facilitate your reporting and to make sure you’re alerted when there is a slowdown is our job at Dareboost, discover our monitoring features.
Why does the Speed Report show URLs from my subdomains?
Select carefully the “property” from the Search Console you want to get the data for. For example, using a “domain” property, you’ll also get the data for the subdomains sharing the same origin (ie: selecting “dareboost.com” property, we would get “blog.dareboost.com” as well as “www.dareboost.com” related data.
Slow pages in the Speed Report, a red flag for your ranking?
Knowing about the Speed Update like we do, you’re probably very interested in the new Search Console Speed Report. A new step from Google to highlight Speed as a ranking factor or to prepare a strengthening of the factor? Still the definition of what would be a Speed ranking factor is still opaque.
According to John Mueller and Martin Splitt’s video, Site Speed: What SEOs Need to Know Google is both using Lab’s Data (synthetic monitoring) and a data source “similar to the Chrome User Experience report data”, and is not focusing on a particular threshold, just roughly categorizing pages…
Here’s the transcription of this part the video:
Basically we are categorizing pages more or less as like really good and pretty bad. So there’s not really like a threshold in between it’s just like we are more or less roughly categorizing the speed experience for users.
And how are we actually doing that ? where do we get the data from ?
We mostly get data from two places on the one hand we try to calculate a theoretical speed of a page using lab data, and then we also use real field data from users who’ve actually tried to use those pages. And that field data is similar to the Chrome User Experience report data
So we are having like hypothetical data and practical data so we don’t really have a threshold to give away but basically the recommendation I would say is just make sites fast for users.

So definitely, keeping an eye on your Speed Report sounds like a good idea.
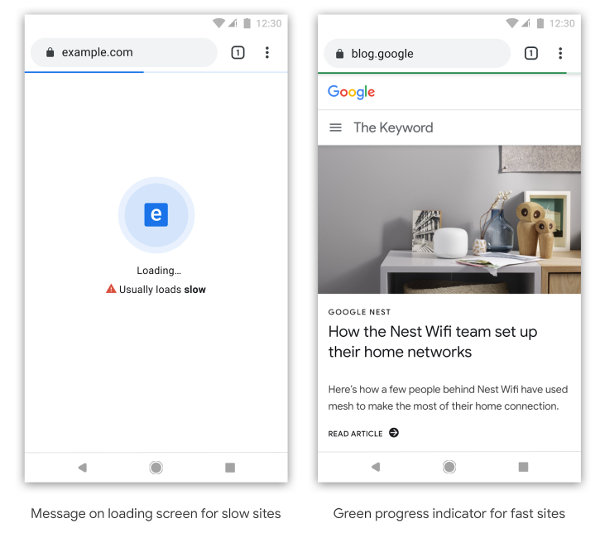
Among the other news from Google this month, an announcement about Chrome: Moving towards a faster web. You may have read some titles in the SEO news “Brace Yourself: Chrome Is About to Shame Slow Websites with a Dedicated Loading Screen!” Reading the article article carefully, we don’t see more than a declaration of intent to dig about this idea.

Let’s discover in the next months if the Chrome Team will conduct such an experiment and hopefully communicate about how they asses that a page load is usually slow (in a given context?)
New Metrics and features to be expected in the Speed Report
During their talk “Speed tooling evolutions: 2019 and beyond” at Chrome Dev Summit 2019, Paul Irish and Elizabeth Sweeny from the Google Chrome Web Platform explained that some new metrics will gain focus : Largest Contentful Paint (LCP) , Total Blocking Time (TBT), and Cumulative Layout Shift (CLS).
Lighthouse version 6 (to be released on January 2020) will use LCP and TBT metrics to compute its new Performance score. CLS has been mentioned to be also used is the future.
If you’re as curious as we are and explore the CrUX data using Bigquery, you’ll note that cumulative_layout_shift is collected (with an “experimental” flag) since May 2019. Largest ContentFul Paint has been introduced in September.
These are some strong signs that we may expect some changes in the future from the Speed Report, with probably some metrics added to the current ones (or replacing them?).
We guess that the Speed Report will progressively be improved with some additional features to explore data by connection type or by country – as already offered by TestMySite, etc. to allow a better understanding of Web Performance in different contexts.
Take your Performance to the Next Level with Dareboost
At Dareboost, we’re monitoring all the changes bring by Google about web performance, either as a Search Engine, or as a web browser vendor. We provide comprehensive tools to our customers to manage easily and efficiently their Web Performance. Discover Dareboost features.

Perfect guide for those who are still not aware or doesn’t fully understand what search console speed report is all about. Using this feature effectively can help improve site speed performance, providing real and measurable results on our website. Thank you for sharing!
Thanks for sharing the complete guide about the search console speed report. These features will help to improve your site speed and its ranking as well. Keep sharing such types of information with us.